

 9:15 PM
 dao viet dung

I am running Red Hat Enterprise Linux on IBM based system. How do I
display bandwidth usage on an interface by host in real time using
command line option? How do I monitor bandwidth usage in a real time on
RHEL or CentOS Linux based server? How can I install iftop utility on
CentOS or RHEL server using the yum command?
You can install and use iftop utility on Linux. This command listens
to network traffic on a given interface (such as eth0 or eth1), and
shows a table of current bandwidth usage by pairs of hosts. iftop must
be run with sufficient permissions (usually as root user) to monitor all
network traffic on the interface.
Install iftop
First, turn on EPEL repo on Linux. See how to install and enable epel repo on CentOS / RHEL / Scientific Linux v4.x/5.x/6.x for more information. Type the following yum command to install iftop on RHEL/CentOS/Fedora Linux:# yum -y install iftopSample outputs:
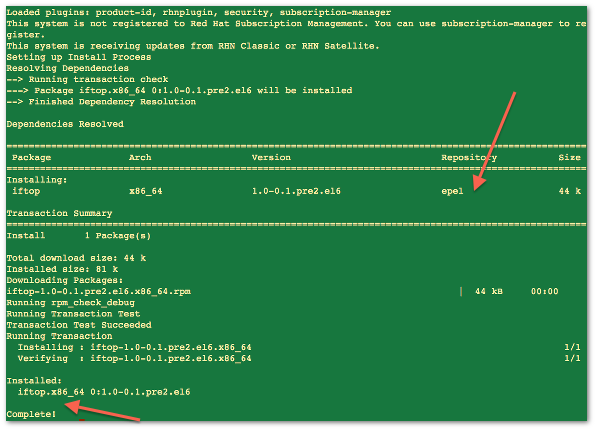
Fig.01: iftop installed using yum command
How do I use iftop command?
The syntax is:iftop iftop [options] iftop -i interface iftop -i eth0 -f filter_code |
Examples
Simply type the following command to monitor traffic on eth0:# iftop -i eth0Sample outputs:

Animated gif 01: iftop in action on CentOS/RHEL
Don’t do DNS hostname lookups
By default, iftop will look up the hostnames associated with addresses it finds in packets. Pass the -n option to disable dns lookup:# iftop -n -i eth0Hide service name and port numbers
Pass the -N option to hide resolve port number to service names:# iftop -N -i eth0Find out packets flowing in and out of 192.168.1.0/24 network
Use the -F option to set net/mask for traffic analysis. In this example, find out packets flowing in and out of the 192.168.1.0/24 network. This is useful to find out if why the network is slow:# iftop -F 192.168.1.0/255.255.255.0 -i eth0icmp bandwidth stats
Find out more about icmp ping requests and bandwidth usage per interface by host. Use the -f to set filter:# iftop -f icmp -i eth0Hide bar graphs
Pass the -b option to turn off display bar graphs of traffic:# iftop -b -i eth0Pass the -B option to display bandwidth rates in bytes/sec rather than bits/sec:
# iftop -B -i eth0Important keyboard shortcuts
- Press t control display type. The t cycles through the four line display modes; the default 2-line display, with sent and received traffic on separate lines, and 3 1-line displays, with sent, received, or total traffic shown.
- Press P to pause the current display.
- Press o to freeze the current screen order. This has the side effect that traffic between hosts not shown on the screen at the time will not be shown at all, although it will be included in the totals at the bottom of the screen.
- Press j and k to scroll the display of hosts. This is useful for busy servers.
 Posted in:


0 comments:
Post a Comment