

Showing posts with label Centos. Show all posts

Tuesday, August 22, 2017

How To Install Iptables Firewall In CentOS 7 Linux

Are you used to the classic iptables firewall and want to kill firewalld? Well there’s still hope for you yet! Here we will show you how to stop and disable the default firewalld firewall and instead install and configure iptables in CentOS 7 Linux.

It’s worth noting that iptables and firewalld are mutually exclusive, only one should be running at any one time. Therefore, if we wish to use either firewalld or iptables we should ensure that the opposite service is completely stopped, disabled, and masked so that it will not interfere.

Disable Firewalld

By default in CentOS 7 Linux, the firewalld firewall will be configured to start up automatically during boot. As we can only run either firewalld or iptables at any one time, we will first disable firewalld.
[root@centos7 ~]# systemctl disable firewalld
Removed symlink /etc/systemd/system/dbus-org.fedoraproject.FirewallD1.service.
Removed symlink /etc/systemd/system/basic.target.wants/firewalld.service.
This disables firewalld from starting automatically on system boot, however it does not stop the current running instance of firewalld from running, so we do that next.
[root@centos7 ~]# systemctl stop firewalld
While firewalld will no longer start automatically at boot and is not currently running, it can still be started manually by command line. To prevent this, we mask the service as shown below.
[root@centos7 ~]# systemctl mask firewalld
Created symlink from /etc/systemd/system/firewalld.service to /dev/null.
We are now ready to install and configure iptables.

Enable Iptables

In my default installation of CentOS 7 I already have the iptables package installed which can be used to run the iptables command, however we also need to install iptables-services in order to have iptables start automatically on system boot.
[root@centos7 ~]# yum install iptables-services -y
We will now check the status of iptables, as shown below after a clean install it will not be currently running and will be set to disabled, that is it will not start automatically on system boot.
[root@centos7 ~]# systemctl status iptables
iptables.service - IPv4 firewall with iptables
   Loaded: loaded (/usr/lib/systemd/system/iptables.service; disabled; vendor preset: disabled)
   Active: inactive (dead)
After the installation is complete, we will configure iptables to start automatically on system boot.
[root@centos7 ~]# systemctl enable iptables
Created symlink from /etc/systemd/system/basic.target.wants/iptables.service to /usr/lib/systemd/system/iptables.service.
Next we will start iptables, activating the firewall.
[root@centos7 ~]# systemctl start iptables
Now if we check the status of iptables, we should see that it is both actively running, and enabled to start on system boot.
[root@centos7 ~]# systemctl status iptables
iptables.service - IPv4 firewall with iptables
   Loaded: loaded (/usr/lib/systemd/system/iptables.service; enabled; vendor preset: disabled)
   Active: active (exited) since Tue 2016-12-27 02:54:27 PST; 1min 52s ago
  Process: 44351 ExecStart=/usr/libexec/iptables/iptables.init start (code=exited, status=0/SUCCESS)
 Main PID: 44351 (code=exited, status=0/SUCCESS)

Dec 27 02:54:27 localhost.localdomain systemd[1]: Starting IPv4 firewall with iptables...
Dec 27 02:54:27 localhost.localdomain iptables.init[44351]: iptables: Applying firewall rules: [  OK  ]
Dec 27 02:54:27 localhost.localdomain systemd[1]: Started IPv4 firewall with iptables.
You can now configure the iptables firewall as usual by modifying the /etc/sysconfig/iptables file. We can confirm this is the correct file to use by using the rpm -qc command against the iptables-services package that we installed earlier, as this will list all default configuration files associated with the package.
[root@centos7 ~]# rpm -qc iptables-services
/etc/sysconfig/ip6tables
/etc/sysconfig/iptables
Note that you will also need to start and enable ip6tables for IPv6, as iptables only supports IPv4. Likewise IPv6 specific firewall configuration should be set within the /etc/sysconfig/ip6tables file.
Each of these files contains default configuration to allow TCP port 22 in from any source IP address, so you don’t have to worry about locking yourself out of SSH access during the configuration.
If you make any changes to either of these files, be sure to restart iptables to apply the changes.
[root@centos7 ~]# systemctl restart iptables

Summary

We have shown you how to easily disable firewalld in CentOS 7 Linux and instead install and configure the classic iptables firewall. Note that iptables is considered deprecated in CentOS 7, so going forward it’s probably worth taking the time to learn how to use firewalld.

Tuesday, January 24, 2017

Installing MsSQL extension on cPanel/WHM server.

Currently there is no script for installing php mssql extension in cpanel server. You have to install it manually.

You need to install a few modules before installing the MsSQL extension.

1. unixODBC

2. freeTDS

3. mssql.so


Do not use rpms as it will show lots of dependency errors. Better download the source file and compile it.

Install unixODBC package

Download source file and install using following steps.

-------
~]# wget http://www.unixodbc.org/unixODBC-2.2.14-p2.tar.gz
~]# tar -xvf unixODBC-2.2.12.tar.gz
~]# cd unixODBC-2.2.12
~]# ./configure -prefix=/usr/local -enable-gui=no    (make sure you use gui option set as 'no' else it will show error message as it don't have Qt package)
~]# make
~]# make install
------

Install freeTDS package

--------
1. Download from ftp://ftp.freetds.org/pub/freetds/old/0.82/freetds-0.82.tar.gz
2. tar -xvf freetds-0.82.tar.gz

3. ./configure -with-tdsver=8.0 -with-unixODBC=/usr/local

4. make

5. make install
---------

Configure freeTDS

1. Locate the freetds.conf and add the following entries. default location is /usr/local/etc/freetds.conf

[MSHOSTNAME]
host = MSHOSTNAME
port = 1433
tds version = 8.0

In cPanel servers the extensions are located at /home/cpeasyapache/src/php-x.x.x/ext. Navigate to the above directory and then to mssql directory.

cd /home/cpeasyapache/src/php-x.x.x/ext/mssql

phpize
./configure
make
make install 

The above commands will generate a copy of mssql.so in the installed extensions directory. Check and make sure that mssql.so is there and add the following to php.ini

---------
# php -i | grep php.ini
Configuration File (php.ini) Path => /usr/local/lib
Loaded Configuration File => /usr/local/lib/php.ini

# vim /usr/local/lib/php.ini
extension=”mssql.so”

-----------
Restart httpd and check the modules using the following command.

~]# php -m | grep mssql
mssql

Saturday, November 26, 2016

Introduction to NcFTP

Introduction to NcFTP

The NcFTP package contains a powerful and flexible interface to the Internet standard File Transfer Protocol. It is intended to replace or supplement the stock ftp program.
This package is known to build and work properly using an LFS-7.10 platform.

Package Information

Installation of NcFTP

There are two ways to build NcFTP. The first (and optimal) way builds most of the functionality as a shared library and then builds and installs the program linked against this library. The second method simply links all of the functionality into the binary statically. This doesn't make the dynamic library available for linking by other applications. You need to choose which method best suits you. Note that the second method does not create an entirely statically linked binary; only the libncftp parts are statically linked in, in this case. Be aware that building and using the shared library is covered by the Clarified Artistic License; however, developing applications that utilize the shared library is subject to a different license.
To install NcFTP using the first (and optimal) method, run the following commands:
./configure --prefix=/usr --sysconfdir=/etc &&
make -C libncftp shared &&
make
This package does not come with a test suite.
Now, as the root user:
make -C libncftp soinstall &&
make install
To install NcFTP using the second method (with the libncftp functionality linked in statically) run the following commands:
./configure --prefix=/usr --sysconfdir=/etc &&
make
This package does not come with a test suite.
Now, as the root user:
make install

Command Explanations

make -C ... && make -C ...: These commands make and install the dynamic library libncftp which is then used to link against when compiling the main program.

Configuring NcFTP

Config Files

/etc/ncftp.* and ~/.ncftp/*; especially /etc/ncftp.prefs_v3 and ~/.ncftp/prefs_v3

Configuration Information

Most NcFTP configuration is done while in the program, and the configuration files are dealt with automatically. One exception to this is ~/.ncftp/prefs_v3. There are various options to alter in there, including:
yes-i-know-about-NcFTPd=yes
This disables the splash screen advertising the NcFTPd server.
There are other options in the prefs_v3 file. Most of these are self-explanatory. Global defaults can be set in /etc/ncftp.prefs_v3.

Contents

Installed Programs: ncftp, ncftpbatch, ncftpbookmarks, ncftpget, ncftpls, ncftpput, and ncftpspooler
Installed Library: libncftp.so
Installed Directories: None

Short Descriptions

ncftp
is a browser program for File Transfer Protocol.
ncftpbatch
is an individual batch FTP job processor.
ncftpbookmarks
is the NcFTP Bookmark Editor (NCurses-based).
ncftpget
is an internet file transfer program for scripts used to retrieve files.
ncftpls
is an internet file transfer program for scripts used to list files.
ncftpput
is an internet file transfer program for scripts used to transfer files.
ncftpspooler
is a global batch FTP job processor daemon.

Thursday, November 24, 2016

How To Migrate Iptables Firewall Rules to a New Server

Introduction

When migrating from one server to another, it is often desirable to migrate the iptables firewall rules as part of the process. This tutorial will show you how to easily copy your active iptables rule set from one server to another.

Prerequisites

This tutorial requires two servers. We will refer to the source server, which has the existing iptables rules, as Server A. The destination server, where the rules will be migrated to, will be referred to as Server B.
You will also need to have superuser, or sudo, access to both servers.

View Existing Iptables Rules

Before migrating your iptables rules, let's see what they are set to. You can do that with this command on Server A:
  • sudo iptables -S
Example output:
-P INPUT ACCEPT -P FORWARD ACCEPT -P OUTPUT ACCEPT -A INPUT -m conntrack --ctstate RELATED,ESTABLISHED -j ACCEPT -A INPUT -p tcp -m tcp --dport 22 -j ACCEPT -A INPUT -p tcp -m tcp --dport 80 -j ACCEPT -A INPUT -s 15.15.15.51/32 -j DROP
The example rules above will be used to demonstrate the firewall migration process.

Export Iptables Rules

The iptables-save command writes the current iptables rules to stdout (standard out). This gives us an easy way to export the firewall rules to file, by redirecting stdout to a file.
On the Server A, the one with the iptables rules that you want to migrate, use the iptables-save to export the current rules to a file named "iptables-export" like this:
  • cd ~
  • sudo iptables-save > iptables-export
This will create the iptables-export file, in your home directory. This file can be used on a different server to load the firewall rules into iptables.

View File Contents (Optional)

Let's take a quick look at the file's contents. We'll use the cat command to print it out to the terminal:
  • cat iptables-export
iptables-export contents:
# Generated by iptables-save v1.4.21 on Tue Sep 1 17:32:29 2015 *filter :INPUT ACCEPT [135:10578] :FORWARD ACCEPT [0:0] :OUTPUT ACCEPT [8364:1557108] -A INPUT -m conntrack --ctstate RELATED,ESTABLISHED -j ACCEPT -A INPUT -p tcp -m tcp --dport 22 -j ACCEPT -A INPUT -p tcp -m tcp --dport 80 -j ACCEPT -A INPUT -s 15.15.15.51/32 -j DROP COMMIT # Completed on Tue Sep 1 17:32:29 2015
As you can see, the file contains the configuration of the active iptables rules. Now we're ready to copy this file to our destination server, Server B.

Copy Exported Rules to Destination Server

We need to copy the rules file to our destination server, Server B. The easiest way to do this is to use scp or to copy and paste the file contents to a new file on Server B. We will demonstrate how to use scp to copy the file over the network to the /tmp directory.
On Server A, run this scp command. Be sure to substitute the highlighted parts with your server's login and IP address:
  • scp iptables-export user@server_b_ip_address:/tmp
After providing proper authentication, the file will be copied to the /tmp directory on Server B. Note that the contents of /tmp are deleted upon a reboot—feel free to place it somewhere else if you want to preserve it.

Import Iptables Rules

With the exported rules on the destination server, you can load them into iptables. However, depending on your situation, you may want update the rules in the file with new IP addresses and ranges, and perhaps update interface names. If you want to change the rules before loading them, be sure to edit the /tmp/iptables-export file now.
Once you are ready to load the rules from the iptables-export file into iptables, let's use the iptables-restore command to do so.
On Server B, the destination server, run this command to load the firewall rules:
  • sudo iptables-restore < /tmp/iptables-export
This will load the rules into iptables. You can verify this with the sudo iptables -S command.

Save Rules

Iptables rules are ephemeral, so special care must be taken for them to persist after a reboot—it is likely that you will want to perform this step on Server B. We will show you how to save the rules on both Ubuntu and CentOS.

Ubuntu

On Ubuntu, the easiest way to save iptables rules, so they will survive a reboot, is to use the iptables-persistent package. Install it with apt-get like this:
  • sudo apt-get install iptables-persistent
During the installation, you will asked if you want to save your current firewall rules. Response yes, if you want to save the current rule set.
If you update your firewall rules in the future, and want to save the changes, run this command:
  • sudo invoke-rc.d iptables-persistent save

CentOS 6 and Older

On CentOS 6 and older—CentOS 7 uses FirewallD by default—you can use the iptables init script to save your iptables rules:
  • sudo service iptables save
This will save your current iptables rules to the /etc/sysconfig/iptables file, which gets loaded by iptables upon boot.

Conclusion

Congratulations! Your firewall rules have been migrated from your original server to your new one.

Monday, November 21, 2016

Elastix 4 installation on CentOS 7 VPS

Elastix 4 on CentOS 7

Elastix is an unified communications server software that brings together IP PBX, email, IM, faxing and collaboration functionality. It has a Web interface and includes capabilities such as a call center software with predictive dialing.

The Elastix functionality is based on open source projects including Asterisk, FreePBX, HylaFAX, Openfire and Postfix. Those packages offer the PBX, fax, instant messaging and email functions, respectively.

Elastix is free software, released under the GNU General Public License.

The tutorial was prepared with our "CentOS 7" template and is meant to work on our self-managed virtual private servers.

0. Preliminary requirements:
"CentOS 7 64-bit" template installed on server.

1. Downloading install scripts:
wget -O Elastix4onCentos7vz.tar.gz --no-check-certificate https://github.com/thpryrchn/Elastix4onCentos7vz/tarball/master

tar zxvf Elastix4onCentos7vz.tar.gz --strip-components=1

2. Installation process
The first script you have to launch is:

./elastix-install-p1.sh

After installation process you have to reboot your server. Now you can launch the second installation script:

./elastix-install-p2.sh

In this step you will be asked to setup MySQL password and your Elastic admin user password. And after this setup you have to reboot your server once again.

And that's it. Now you can login to your Elastic web interface with password you have entered and manage your Elastix instance:

http://yourhostname

Friday, October 21, 2016

Timezone-How do I set the Hardware Clock to the current System Time?

Use the following syntax:
# hwclock --systohc

OR
# hwclock -w

Tuesday, October 11, 2016

Elastix 2.4 VMWare Appliance Deployment Guide

Elastix is licensed under GNU General Public License. Feel free to download via torrent from this torrent magnet URL
 
Elastix is an open source unified communications server software that brings together IP PBX, email, IM, faxing and collaboration functionality. It has a Web interface and includes capabilities such as a call center software with predictive dialing.
The Elastix functionality is based on open source projects including Asterisk, HylaFAX, Openfire and Postfix. Those packages offer the PBX, fax, instant messaging and email functions, respectively.


DEPLOY THE OVA TO YOUR VIRTUAL INFRASTRUCTURE

 
The admin, root and MySQL password of this VM Appliance have been set to Elastix. It is recommended you change this after you have finished deployment by clicking the person icon in the top right once logged in and selecting ‘Change Elastix Password’

Once downloaded,  Open your vSphere or Infrastructure client and connect to your VMWare ESXi or VCenter host
Click File, Deploy OVF Template
image

Select the local location of the Elastix 2.4 *.ova Appliance file
 
 image
 
Take note of the password set which is Elastix (capital E). Click Next.

image
Give your new Elastix PABX a name so you can easily identify it. Click Next.
 
image
Select the hard drive or LUN to deploy the appliance . Click Next.
 
image
Select whether you would like to deploy Thick or Thin provision. The default ‘Thick Provision Lazy Zeroed’ is fine. Click Next.
 
image
Select the host or cluster to deploy the Elastix VM Appliance to. Click Next.

image
 
Select the vNIC interface you would like to set the appliance to boot on. Click Next.
image
 
Tick the ‘Power on after deployment’ checkbox and click Finish
image
 
Depending on network and disk speed this process will take several minutes
image 
 

BOOT UP YOUR NEW ELASTIX VIRTUAL APPLIANCE

 
One the VM has been deployed and is booted, open the console and login with username root and password Elastix
image
Once logged into the console as root you will be shown the URL in which you can access Elastix. If you hit http://xx.xx.xx.xx where xx.xx.xx.xx is the IP assigned by your DHCP server on the network you will be prompted for login credentials
image
 
Using the URL from the console login to the elastix web GUI with username admin and password Elastix
image
 
Once you login to the web GUI, change your Elastix admin password by clicking on the person icon in the top right and select ‘Change Elastix Password’
 
image
 
To change to root password, go back to the console and type passwd. You will then be prompted to type in a new UNIX password.
image
 
To change the FreePBX MySQL password (thanks to http://my.synapseglobal.com/knowledgebase.php?action=displayarticle&id=25 for these steps)

from the VM appliance console:
mysqladmin -u asteriskuser -p password newpass

You can find the current database username and password in:
/etc/amportal.conf

Now verify that the new password works:
mysql -u asteriskuser –p

Once you change the password using mysqladmin, you will need to modify
/etc/amportal.conf

to also use the new password.
We suggest making a copy of:
/etc/amportal.conf
before you edit it.

Simply type:
cp /etc/amportal.conf /etc/amportal.conf.bak
at the shell prompt to copy the current amportal.conf file into a new file called amportal.conf.bak
Inside /etc/amportal.conf you will want to check these two lines:
AMPDBUSER=asteriskuser
AMPDBPASS=newpass
Make sure that they both match the username and password (new password) you set above.
There are two more files you should modify in the same way:
/etc/asterisk/cdr_mysql.conf:
check these two lines:
password=newpass
user=asteriskuser

And:

/etc/asterisk/res_mysql.conf:

Check these two lines:
dbuser = asteriskuser
dbpass = newpass

Tuesday, July 5, 2016

Cài đặt Elastix 4.0

Link

Reset Elastix Web Interface Admin Password

This requires that you can log into the server at the console, or via SSH. If you dont have the login details to log into the console, or ssh in, you will need to reset the root password.

After logged in, to reset the admin account password for the Elastix web interface using below command:

elastix-admin-passwords --change

Then input new mysql password and new admin elastix password

DONE

Tham khảo:


Tuesday, May 3, 2016

Install iftop To Display Bandwidth Usage Per interface By Host

I am running Red Hat Enterprise Linux on IBM based system. How do I display bandwidth usage on an interface by host in real time using command line option? How do I monitor bandwidth usage in a real time on RHEL or CentOS Linux based server? How can I install iftop utility on CentOS or RHEL server using the yum command?

You can install and use iftop utility on Linux. This command listens to network traffic on a given interface (such as eth0 or eth1), and shows a table of current bandwidth usage by pairs of hosts. iftop must be run with sufficient permissions (usually as root user) to monitor all network traffic on the interface.

Install iftop

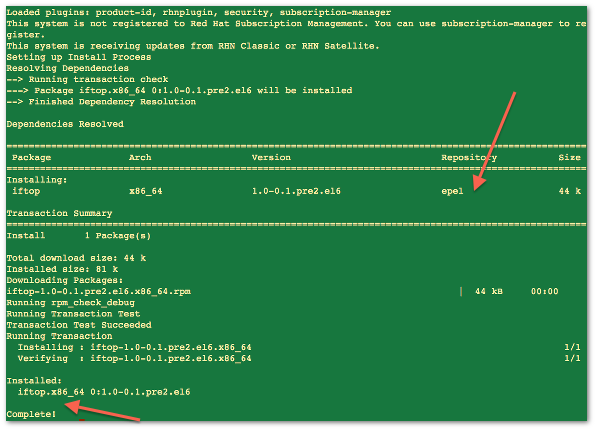
First, turn on EPEL repo on Linux. See how to install and enable epel repo on CentOS / RHEL / Scientific Linux v4.x/5.x/6.x for more information. Type the following yum command to install iftop on RHEL/CentOS/Fedora Linux:
# yum -y install iftop
Sample outputs:
Fig.01: iftop installed using yum command

How do I use iftop command?

The syntax is:
iftop
iftop [options]
iftop -i interface
iftop -i eth0 -f filter_code

Examples

Simply type the following command to monitor traffic on eth0:
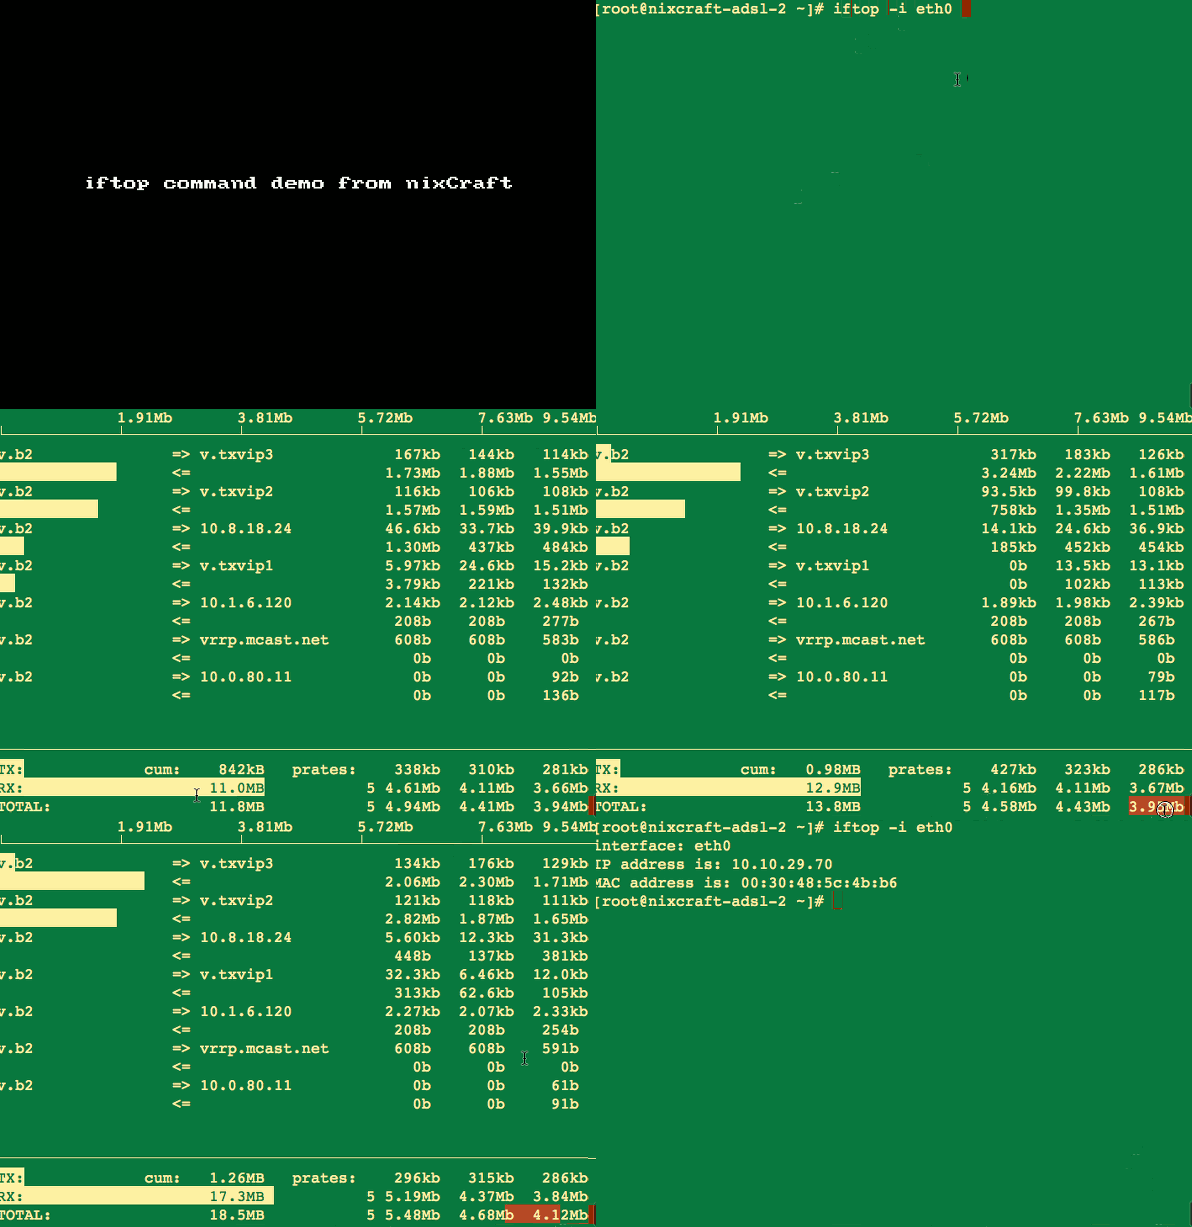
# iftop -i eth0
Sample outputs:
Animated gif 01: iftop in action on CentOS/RHEL

Don’t do DNS hostname lookups

By default, iftop will look up the hostnames associated with addresses it finds in packets. Pass the -n option to disable dns lookup:
# iftop -n -i eth0

Hide service name and port numbers

Pass the -N option to hide resolve port number to service names:
# iftop -N -i eth0

Find out packets flowing in and out of 192.168.1.0/24 network

Use the -F option to set net/mask for traffic analysis. In this example, find out packets flowing in and out of the 192.168.1.0/24 network. This is useful to find out if why the network is slow:
# iftop -F 192.168.1.0/255.255.255.0 -i eth0

icmp bandwidth stats

Find out more about icmp ping requests and bandwidth usage per interface by host. Use the -f to set filter:
# iftop -f icmp -i eth0

Hide bar graphs

Pass the -b option to turn off display bar graphs of traffic:
# iftop -b -i eth0
Pass the -B option to display bandwidth rates in bytes/sec rather than bits/sec:
# iftop -B -i eth0

Important keyboard shortcuts

  1. Press t control display type. The t cycles through the four line display modes; the default 2-line display, with sent and received traffic on separate lines, and 3 1-line displays, with sent, received, or total traffic shown.
  2. Press P to pause the current display.
  3. Press o to freeze the current screen order. This has the side effect that traffic between hosts not shown on the screen at the time will not be shown at all, although it will be included in the totals at the bottom of the screen.
  4. Press j and k to scroll the display of hosts. This is useful for busy servers.

How to verify DDOS attack with netstat command on Linux Terminal

Your server appearing pretty slow could be many things from wrong configs, scripts and dodgy hardware – but sometimes it could be because someone is flooding your server with traffic known as DoS ( Denial of Service ) or DDoS ( Distributed Denial of Service ).
Denial-of-service attack (DoS attack) or Distributed Denial-of-service attack (DDoS attack) is an attempt to make a machine or network resource unavailable to its intended users. This attack generally target sites or services hosted on high-profile web servers such as banks, credit card payment gateways, and even root nameservers. DoS attacks are implemented by either forcing the targeted computer to reset, or consuming its resources so that it can no longer provide its services or obstructs the communication media between the users and the victim so that they can no longer communicate adequately.
In this small article you’ll see how to check if your server is under attack from the Linux Terminal with the netstat command


From the man page of netstat “netstat – Print network connections, routing tables, interface statistics, masquerade connections, and multicast memberships”
Some examples with explanation

netstat -na
This display all active Internet connections to the server and only established connections are included.
netstat -an | grep :80 | sort
Show only active Internet connections to the server on port 80, this is the http port and so it’s useful if you have a web server, and sort the results. Useful in detecting a single flood by allowing you to recognize many connections coming from one IP.
netstat -n -p|grep SYN_REC | wc -l
This command is useful to find out how many active SYNC_REC are occurring on the server. The number should be pretty low, preferably less than 5. On DoS attack incidents or mail bombs, the number can jump to pretty high. However, the value always depends on system, so a high value may be average on another server.
netstat -n -p | grep SYN_REC | sort -u
List out the all IP addresses involved instead of just count.
netstat -n -p | grep SYN_REC | awk '{print $5}' | awk -F: '{print $1}'
List all the unique IP addresses of the node that are sending SYN_REC connection status.
netstat -ntu | awk '{print $5}' | cut -d: -f1 | sort | uniq -c | sort -n
Use netstat command to calculate and count the number of connections each IP address makes to the server.
netstat -anp |grep 'tcp|udp' | awk '{print $5}' | cut -d: -f1 | sort | uniq -c | sort -n
List count of number of connections the IPs are connected to the server using TCP or UDP protocol.
netstat -ntu | grep ESTAB | awk '{print $5}' | cut -d: -f1 | sort | uniq -c | sort -nr
Check on ESTABLISHED connections instead of all connections, and displays the connections count for each IP.
netstat -plan|grep :80|awk {'print $5'}|cut -d: -f 1|sort|uniq -c|sort -nk 1
Show and list IP address and its connection count that connect to port 80 on the server. Port 80 is used mainly by HTTP web page request.

How to mitigate a DOS attack

Once that you have found the IP that are attacking your server you can use the following commands to block their connection to your server:
iptables -A INPUT 1 -s $IPADRESS -j DROP/REJECT
Please note that you have to replace $IPADRESS with the IP numbers that you have found with netstat.
After firing the above command, KILL all httpd connections to clean your system and than restart httpd service by
using the following commands:
killall -KILL httpd
 
service httpd start           #For Red Hat systems 
/etc/init/d/apache2 restart   #For Debian systems

Thursday, April 14, 2016

Find number of unique IP’s and active connections to Web server

In computing, netstat (network statistics) is a command-line tool that displays network connections (both incoming and outgoing), routing tables, and a number of network interface (network interface controller or software-defined network interface) and network protocol statistics. It is available on Unix-like operating systems including OS X, Linux, Solaris, and BSD, and is available on Windows NT-based operating systems including Windows XP, Windows Vista, Windows 7 and Windows 8. Find number Unique IP's and active connections to Web server - blackMORE Ops
It is used for finding problems in the network and to determine the amount of traffic on the network as a performance measurement.
netstat is the most frequent tool used for monitoring network connections on a Linux servers. netstat returns a variety of information on active connections such as their current status, what hosts are involved, and which programs are involved. You can also see information about the routing table and even get statistics on your network interfaces. netstat is a good all-around utility and it is an essential tool for the Linux administrators.
If you just type netstat, it would display a long list of information that’s usually more than you want to go through at any given time. The trick is that how to keeping the information useful and what you’re looking for and how to tell netstat to only display that information.
Users can also use man netstat command to get detailed netstat help and manual where there are lots of configurable options and flags to get meaningful lists and results.

The Holy Grail of netstat – My way

My requirements are simple:
  1. I want to see all users connected to my server
  2. I only want to see users on port 80 (http)
  3. I want to see total number of connections per IP
  4. I don’t want to see my own server’s IP in the output
  5. I want to sort them Max to Min.
Following commands will do just that. I am using the usual netstatty things. I will break down each command as I go:

Step 1: Show active connections – TCP and UDP Internet  (w/o servers)

First of all lets just check the active TCP and UDP connections.
netstat -ntu
-ntu = TCP and UDP connections in numeric order (w/o servers).

Step 2: Show all active connections – (/w servers and established)

Well, that’s good. But how do I know what ports I am listening to? I need that cause I want to check that my server is not listening to any funky ports. If it does, then I got either mis-configured services or my server is compromised.
So I will just add ‘ -a ‘ flag in this command.
netstat -antu
-antu = All TCP and UDP connections in numeric order (with servers and established)
I’ve seen way too many guides where people go an use ‘ plan ‘ flag .. ‘ -a ‘ already includes everything, ‘ -l ‘ is not required.

Step 3: Show all active connections to Web server

Now that I have a decent output, I can start working on it. In this particular output, I got all sorts active TCP and UDP Internet connections on every open port. I want to narrow it down to port 80 only (HTTP Port). I will use grep to narrow down on that.
netstat -antu | grep :80
Nice, now I see active TCP and UDP Internet connections on port 80 only. (in fact it will be all TCP as HTTP is a TCP service). You can use netstat -anu to list UDP connections.

Step 4: Show all active connections to Web server excluding self IP’s

So far I managed to list all active TCP and UDP connections and filter my results for port 80. But I can see few entries like following:
tcp        0      0 0.0.0.0:80                  0.0.0.0:*                   LISTEN      
tcp        0      0 :::80                       :::*                        LISTEN
I don’t want to exclude that as it is just loopback address. I am more interested to see foreign IP’s connected to my website. So I will just use grep -v to exclude these connections.
netstat -antu | grep :80 | grep -v LISTEN

>> Sample output

root@kali [~]# netstat -antu | grep :80 | grep -v LISTEN 
tcp        0      0 127.0.0.1:80             202.28.177.61:59818         SYN_RECV    
tcp        0      0 127.0.0.1:80             202.28.177.61:40560         SYN_RECV    
tcp        0      0 127.0.0.1:80             202.28.177.61:50523         SYN_RECV    
tcp        0      0 127.0.0.1:80             202.28.177.61:55520         SYN_RECV    
tcp        0      0 127.0.0.1:80             68.204.187.5:50420          TIME_WAIT   
tcp        0      0 127.0.0.1:80             202.28.177.61:41423         TIME_WAIT   
tcp        0      0 127.0.0.1:80             24.232.175.224:45254        TIME_WAIT   
tcp        0      0 127.0.0.1:80             68.204.187.5:50465          TIME_WAIT   
tcp        0      0 127.0.0.1:80             202.28.177.61:43653         TIME_WAIT   
tcp        0      0 127.0.0.1:80             202.28.177.61:33851         TIME_WAIT

Step 5: Show all active connections to Web server – IP: Port only

Now I want to do more. I want to exclude everything and only list foreign IP addresses. I need some sort of filter. awk is exactly the tool I need to use here. But how do I know which field to filter?
Let’s look at a sample output from previous command.
tcp        0      0 127.0.0.1:80             202.28.177.61:59818         SYN_RECV
In the above line, I am only interested on the foreign IP 202.28.177.61. awk has the capability to do data extraction. Let’s count the fields.
(1)tcp    (2)0    (3)0  (4)127.0.0.1:80   (5)202.28.177.61:59818         (6)SYN_RECV
Note that, 127.0.0.1:80 and 202.28.177.61:59818 is counted as one field as they don’t have any spaces.
So, let’s try to list the 5th field which contains all the foreign IP addresses.
netstat -antu | grep :80 | grep -v LISTEN | awk '{print $5}'

>> Sample output

root@kali [~]# netstat -antu | grep :80 | grep -v LISTEN | awk '{print $5}' 
113.173.16.70:26985
50.106.33.249:49292
113.173.16.70:26982
66.87.131.102:4370
113.173.16.70:26996
175.143.49.222:19709
66.87.131.102:4386
87.76.5.167:18296
23.24.156.251:57306
222.66.184.182:56000

Step 6: Show all active connections to Web server – IP’s only

The last output looks good to me. I managed to list only foreign addresses. But If you look closely, you will see same foreign IP is listed more than once on different ports. It is essentially the same user (or groups of users behind same proxy).
Let’s go one step further, I now want to see foreign IP’s only without their originating ports. I will be using cut for that. cut will allow me to cut every line at the first space character and take the first piece.
netstat -antu | grep :80 | grep -v LISTEN | awk '{print $5}' | cut -d: -f1
I am using -d: to let cut know that I am using the (:) colon character as the field delimiter.
By using -f1 I am telling cut to give me the first field (which is the IP address before the colon character).

>> Sample output

root@kali [~]# netstat -antu | grep :80 | grep -v LISTEN | awk '{print $5}' | cut -d: -f1  
99.104.23.221
99.104.23.221
2.50.116.13
5.239.12.118
99.104.23.221
99.104.23.221
66.249.81.52
99.104.23.221
218.80.192.208
99.104.23.221

Step 7: Show all active connections to Web server – sorted and unique

Now the output contains only foreign IP addresses. We now need to sort them, and then pipe it to uniq command so that we are left with unique foreign IP in a sorted manner. I also want uniq command to count the number of connections per IP.
netstat -antu | grep :80 | grep -v LISTEN | awk '{print $5}' | cut -d: -f1 | sort | uniq -c
uniq -c will count total number of connections per IP.

>> Sample output

root@kali [~]# netstat -antu | grep :80 | grep -v LISTEN | awk '{print $5}' | cut -d: -f1 | sort | uniq -c
     14 112.204.9.125
      1 113.173.16.70
      4 124.176.50.119
      1 125.163.235.42
      1 175.136.237.182
      1 178.26.19.53
      1 180.76.6.44
     12 202.28.177.61

Step 8: Show all active connections to Web server – connection count

But hang on, uniq -c did count it and sorted them as per IP addresses. Let’s re-sort this list to show Max to Min number of connections per unique IP (foreign IP’s only).
netstat -antu | grep :80 | grep -v LISTEN | awk '{print $5}' | cut -d: -f1 | sort | uniq -c | sort -rn

>> Sample output

root@kali [~]# netstat -ntu | grep :80 | grep -v LISTEN | awk '{print $5}' | cut -d: -f1 | sort | uniq -c | sort -rn 
     44 92.45.59.194
     37 121.52.153.215
     35 212.14.31.37
     28 76.177.223.119
     28 37.228.105.222
     27 182.186.25.222
      8 13.1.89.53
      6 127.0.0.1

Step 9: Show all active connections to Web server – exclude self IP’s

It’s all good so far. But I can see my own server’s IP in that list. (i.e. 127.0.0.1). If I can just exclude that, I will be left with Foreign IP’s only. I will use grep -v to exclude that line.
root@kali [~]# netstat -ntu | grep :80 | grep -v LISTEN | awk '{print $5}' | cut -d: -f1 | sort | uniq -c | sort -rn | grep -v 127.0.0.1

>> Sample output

root@kali [~]# netstat -ntu | grep :80 | grep -v LISTEN | awk '{print $5}' | cut -d: -f1 | sort | uniq -c | sort -rn | grep -v 127.0.0.1
     45 108.168.173.83
     36 174.45.176.119
     35 70.39.187.230
     34 175.144.92.225
     24 139.195.97.102
     19 69.142.186.97
     18 150.101.190.51
     12 50.150.246.167

Step 10: Final count of all active IP’s to Web server

This is now working just the way I wanted. Let’s do a final count of total number of unique IP’s connected to my server.
root@kali [~]# netstat -ntu | grep :80 | grep -v LISTEN | awk '{print $5}' | cut -d: -f1 | sort | uniq -c | sort -rn | grep -v 127.0.0.1 | wc -l

>> Sample output

root@kali [~]# netstat -ntu | grep :80 | grep -v LISTEN | awk '{print $5}' | cut -d: -f1 | sort | uniq -c | sort -rn | grep -v 127.0.0.1 | wc -l
768
wc -l does a line count..
It means I’ve got 768 unique IP’s connected right now.

Step 11: Final count of all active connections to Web server

Last but not the least, I want a total count of connections to port 80 from all foreign IP’s.
netstat -ntu | grep :80 | grep -v LISTEN | awk '{print $5}' | cut -d: -f1 | grep -v 127.0.0.1 | wc -l

>> Sample output

root@kali [~]# netstat -ntu | grep :80 | grep -v LISTEN | awk '{print $5}' | cut -d: -f1 | grep -v 127.0.0.1 | wc -l
1847
That means I’ve got 1847 connections opened right now from all external IP’s to port 80 on my server.

Conclusion

netstat is the most useful tool to detect and determine whether a server is under DoS or DDoS attack (Distributed Denial of Service). Whenever a client connects to a server via network, a connection is established and opened on the system. On a busy high load server, the number of connections connected to the server can be run into large amount till hundreds if not thousands. Find out and get a list of connections on the server by each node, client or IP address is useful for system scaling planning, and in most cases, detect and determine whether a web server is under DoS or DDoS attack (Distributed Denial of Service), where an IP sends large amount of connections to the server. To check connection numbers on the server, administrators and webmasters can make use of netstat command.
Do I think my way of using netstat is the best? Absolutely! Why? Cause it always worked for me.
I don’t know whether your sever is running on port 80 or if you’re getting DDoS on a different port (i.e. port 25 or 443), but the above command serves my purpose every time. There’s 10 different ways to skin a cat and I like my way. I’ve broken down my way of using netstat command to the last straw and once you follow it from top to bottom, you will get used to it and in time you will find your own perfect command.
There is no best way, only the way that works for you.

Further helpful links, sources and references:

Following links are awesome and they have lots of examples on how to use netstat. Though they might not be very explanatory, but if you understand the basics, then they are a useful resource to have on netstat.
  1. Netstat on Wiki
  2. The Geek Stuff
  3. My Digital Life
  4. BinaryTides

20 Netstat Commands for Linux Network Management

netstat (network statistics) is a command line tool for monitoring network connections both incoming and outgoing as well as viewing routing tables, interface statistics etc. netstat is available on all Unix-like Operating Systems and also available on Windows OS as well. It is very useful in terms of network troubleshooting and performance measurement. netstat is one of the most basic network service debugging tools, telling you what ports are open and whether any programs are listening on ports.
Linux Netstat Command
This tool is very important and much useful for Linux network administrators as well as system administrators to monitor and troubleshoot their network related problems and determine network traffic performance. This article shows usages of netstat command with their examples which may be useful in daily operation.

You might also be interested in following article
  1. 35 Practical Examples of Linux Find Command

1. Listing all the LISTENING Ports of TCP and UDP connections

Listing all ports (both TCP and UDP) using netstat -a option.
# netstat -a | more

Active Internet connections (servers and established)
Proto Recv-Q Send-Q Local Address               Foreign Address             State
tcp        0      0 *:sunrpc                    *:*                         LISTEN
tcp        0     52 192.168.0.2:ssh             192.168.0.1:egs             ESTABLISHED
tcp        1      0 192.168.0.2:59292           www.gov.com:http            CLOSE_WAIT
tcp        0      0 localhost:smtp              *:*                         LISTEN
tcp        0      0 *:59482                     *:*                         LISTEN
udp        0      0 *:35036                     *:*
udp        0      0 *:npmp-local                *:*

Active UNIX domain sockets (servers and established)
Proto RefCnt Flags       Type       State         I-Node Path
unix  2      [ ACC ]     STREAM     LISTENING     16972  /tmp/orbit-root/linc-76b-0-6fa08790553d6
unix  2      [ ACC ]     STREAM     LISTENING     17149  /tmp/orbit-root/linc-794-0-7058d584166d2
unix  2      [ ACC ]     STREAM     LISTENING     17161  /tmp/orbit-root/linc-792-0-546fe905321cc
unix  2      [ ACC ]     STREAM     LISTENING     15938  /tmp/orbit-root/linc-74b-0-415135cb6aeab

2. Listing TCP Ports connections

Listing only TCP (Transmission Control Protocol) port connections using netstat -at.
# netstat -at

Active Internet connections (servers and established)
Proto Recv-Q Send-Q Local Address               Foreign Address             State
tcp        0      0 *:ssh                       *:*                         LISTEN
tcp        0      0 localhost:ipp               *:*                         LISTEN
tcp        0      0 localhost:smtp              *:*                         LISTEN
tcp        0     52 192.168.0.2:ssh             192.168.0.1:egs             ESTABLISHED
tcp        1      0 192.168.0.2:59292           www.gov.com:http            CLOSE_WAIT

3. Listing UDP Ports connections

Listing only UDP (User Datagram Protocol ) port connections using netstat -au.
# netstat -au

Active Internet connections (servers and established)
Proto Recv-Q Send-Q Local Address               Foreign Address             State
udp        0      0 *:35036                     *:*
udp        0      0 *:npmp-local                *:*
udp        0      0 *:mdns                      *:*

4. Listing all LISTENING Connections

Listing all active listening ports connections with netstat -l.
# netstat -l

Active Internet connections (only servers)
Proto Recv-Q Send-Q Local Address               Foreign Address             State
tcp        0      0 *:sunrpc                    *:*                         LISTEN
tcp        0      0 *:58642                     *:*                         LISTEN
tcp        0      0 *:ssh                       *:*                         LISTEN
udp        0      0 *:35036                     *:*
udp        0      0 *:npmp-local                *:*

Active UNIX domain sockets (only servers)
Proto RefCnt Flags       Type       State         I-Node Path
unix  2      [ ACC ]     STREAM     LISTENING     16972  /tmp/orbit-root/linc-76b-0-6fa08790553d6
unix  2      [ ACC ]     STREAM     LISTENING     17149  /tmp/orbit-root/linc-794-0-7058d584166d2
unix  2      [ ACC ]     STREAM     LISTENING     17161  /tmp/orbit-root/linc-792-0-546fe905321cc
unix  2      [ ACC ]     STREAM     LISTENING     15938  /tmp/orbit-root/linc-74b-0-415135cb6aeab

5. Listing all TCP Listening Ports

Listing all active listening TCP ports by using option netstat -lt.
# netstat -lt

Active Internet connections (only servers)
Proto Recv-Q Send-Q Local Address               Foreign Address             State
tcp        0      0 *:dctp                      *:*                         LISTEN
tcp        0      0 *:mysql                     *:*                         LISTEN
tcp        0      0 *:sunrpc                    *:*                         LISTEN
tcp        0      0 *:munin                     *:*                         LISTEN
tcp        0      0 *:ftp                       *:*                         LISTEN
tcp        0      0 localhost.localdomain:ipp   *:*                         LISTEN
tcp        0      0 localhost.localdomain:smtp  *:*                         LISTEN
tcp        0      0 *:http                      *:*                         LISTEN
tcp        0      0 *:ssh                       *:*                         LISTEN
tcp        0      0 *:https                     *:*                         LISTEN

6. Listing all UDP Listening Ports

Listing all active listening UDP ports by using option netstat -lu.
# netstat -lu

Active Internet connections (only servers)
Proto Recv-Q Send-Q Local Address               Foreign Address             State
udp        0      0 *:39578                     *:*
udp        0      0 *:meregister                *:*
udp        0      0 *:vpps-qua                  *:*
udp        0      0 *:openvpn                   *:*
udp        0      0 *:mdns                      *:*
udp        0      0 *:sunrpc                    *:*
udp        0      0 *:ipp                       *:*
udp        0      0 *:60222                     *:*
udp        0      0 *:mdns                      *:*

7. Listing all UNIX Listening Ports

Listing all active UNIX listening ports using netstat -lx.
# netstat -lx

Active UNIX domain sockets (only servers)
Proto RefCnt Flags       Type       State         I-Node Path
unix  2      [ ACC ]     STREAM     LISTENING     4171   @ISCSIADM_ABSTRACT_NAMESPACE
unix  2      [ ACC ]     STREAM     LISTENING     5767   /var/run/cups/cups.sock
unix  2      [ ACC ]     STREAM     LISTENING     7082   @/tmp/fam-root-
unix  2      [ ACC ]     STREAM     LISTENING     6157   /dev/gpmctl
unix  2      [ ACC ]     STREAM     LISTENING     6215   @/var/run/hald/dbus-IcefTIUkHm
unix  2      [ ACC ]     STREAM     LISTENING     6038   /tmp/.font-unix/fs7100
unix  2      [ ACC ]     STREAM     LISTENING     6175   /var/run/avahi-daemon/socket
unix  2      [ ACC ]     STREAM     LISTENING     4157   @ISCSID_UIP_ABSTRACT_NAMESPACE
unix  2      [ ACC ]     STREAM     LISTENING     60835836 /var/lib/mysql/mysql.sock
unix  2      [ ACC ]     STREAM     LISTENING     4645   /var/run/audispd_events
unix  2      [ ACC ]     STREAM     LISTENING     5136   /var/run/dbus/system_bus_socket
unix  2      [ ACC ]     STREAM     LISTENING     6216   @/var/run/hald/dbus-wsUBI30V2I
unix  2      [ ACC ]     STREAM     LISTENING     5517   /var/run/acpid.socket
unix  2      [ ACC ]     STREAM     LISTENING     5531   /var/run/pcscd.comm

8. Showing Statistics by Protocol

Displays statistics by protocol. By default, statistics are shown for the TCP, UDP, ICMP, and IP protocols. The -s parameter can be used to specify a set of protocols.
# netstat -s

Ip:
    2461 total packets received
    0 forwarded
    0 incoming packets discarded
    2431 incoming packets delivered
    2049 requests sent out
Icmp:
    0 ICMP messages received
    0 input ICMP message failed.
    ICMP input histogram:
    1 ICMP messages sent
    0 ICMP messages failed
    ICMP output histogram:
        destination unreachable: 1
Tcp:
    159 active connections openings
    1 passive connection openings
    4 failed connection attempts
    0 connection resets received
    1 connections established
    2191 segments received
    1745 segments send out
    24 segments retransmited
    0 bad segments received.
    4 resets sent
Udp:
    243 packets received
    1 packets to unknown port received.
    0 packet receive errors
    281 packets sent

9. Showing Statistics by TCP Protocol

Showing statistics of only TCP protocol by using option netstat -st.
# netstat -st

Tcp:
    2805201 active connections openings
    1597466 passive connection openings
    1522484 failed connection attempts
    37806 connection resets received
    1 connections established
    57718706 segments received
    64280042 segments send out
    3135688 segments retransmited
    74 bad segments received.
    17580 resets sent

10. Showing Statistics by UDP Protocol

# netstat -su

Udp:
    1774823 packets received
    901848 packets to unknown port received.
    0 packet receive errors
    2968722 packets sent

11. Displaying Service name with PID

Displaying service name with their PID number, using option netstat -tp will display “PID/Program Name”.
# netstat -tp

Active Internet connections (w/o servers)
Proto Recv-Q Send-Q Local Address               Foreign Address             State       PID/Program name
tcp        0      0 192.168.0.2:ssh             192.168.0.1:egs             ESTABLISHED 2179/sshd
tcp        1      0 192.168.0.2:59292           www.gov.com:http            CLOSE_WAIT  1939/clock-applet

12. Displaying Promiscuous Mode

Displaying Promiscuous mode with -ac switch, netstat print the selected information or refresh screen every five second. Default screen refresh in every second.
# netstat -ac 5 | grep tcp

tcp        0      0 *:sunrpc                    *:*                         LISTEN
tcp        0      0 *:58642                     *:*                         LISTEN
tcp        0      0 *:ssh                       *:*                         LISTEN
tcp        0      0 localhost:ipp               *:*                         LISTEN
tcp        0      0 localhost:smtp              *:*                         LISTEN
tcp        1      0 192.168.0.2:59447           www.gov.com:http            CLOSE_WAIT
tcp        0     52 192.168.0.2:ssh             192.168.0.1:egs             ESTABLISHED
tcp        0      0 *:sunrpc                    *:*                         LISTEN
tcp        0      0 *:ssh                       *:*                         LISTEN
tcp        0      0 localhost:ipp               *:*                         LISTEN
tcp        0      0 localhost:smtp              *:*                         LISTEN
tcp        0      0 *:59482                     *:*                         LISTEN

13. Displaying Kernel IP routing

Display Kernel IP routing table with netstat and route command.
# netstat -r

Kernel IP routing table
Destination     Gateway         Genmask         Flags   MSS Window  irtt Iface
192.168.0.0     *               255.255.255.0   U         0 0          0 eth0
link-local      *               255.255.0.0     U         0 0          0 eth0
default         192.168.0.1     0.0.0.0         UG        0 0          0 eth0

14. Showing Network Interface Transactions

Showing network interface packet transactions including both transferring and receiving packets with MTU size.
# netstat -i

Kernel Interface table
Iface       MTU Met    RX-OK RX-ERR RX-DRP RX-OVR    TX-OK TX-ERR TX-DRP TX-OVR Flg
eth0       1500   0     4459      0      0      0     4057      0      0      0 BMRU
lo        16436   0        8      0      0      0        8      0      0      0 LRU

15. Showing Kernel Interface Table

Showing Kernel interface table, similar to ifconfig command.
# netstat -ie

Kernel Interface table
eth0      Link encap:Ethernet  HWaddr 00:0C:29:B4:DA:21
          inet addr:192.168.0.2  Bcast:192.168.0.255  Mask:255.255.255.0
          inet6 addr: fe80::20c:29ff:feb4:da21/64 Scope:Link
          UP BROADCAST RUNNING MULTICAST  MTU:1500  Metric:1
          RX packets:4486 errors:0 dropped:0 overruns:0 frame:0
          TX packets:4077 errors:0 dropped:0 overruns:0 carrier:0
          collisions:0 txqueuelen:1000
          RX bytes:2720253 (2.5 MiB)  TX bytes:1161745 (1.1 MiB)
          Interrupt:18 Base address:0x2000

lo        Link encap:Local Loopback
          inet addr:127.0.0.1  Mask:255.0.0.0
          inet6 addr: ::1/128 Scope:Host
          UP LOOPBACK RUNNING  MTU:16436  Metric:1
          RX packets:8 errors:0 dropped:0 overruns:0 frame:0
          TX packets:8 errors:0 dropped:0 overruns:0 carrier:0
          collisions:0 txqueuelen:0
          RX bytes:480 (480.0 b)  TX bytes:480 (480.0 b)

16. Displaying IPv4 and IPv6 Information

Displays multicast group membership information for both IPv4 and IPv6.
# netstat -g

IPv6/IPv4 Group Memberships
Interface       RefCnt Group
--------------- ------ ---------------------
lo              1      all-systems.mcast.net
eth0            1      224.0.0.251
eth0            1      all-systems.mcast.net
lo              1      ff02::1
eth0            1      ff02::202
eth0            1      ff02::1:ffb4:da21
eth0            1      ff02::1

17. Print Netstat Information Continuously

To get netstat information every few second, then use the following command, it will print netstat information continuously, say every few seconds.
# netstat -c

Active Internet connections (w/o servers)
Proto Recv-Q Send-Q Local Address               Foreign Address             State
tcp        0      0 tecmint.com:http   sg2nlhg007.shr.prod.s:36944 TIME_WAIT
tcp        0      0 tecmint.com:http   sg2nlhg010.shr.prod.s:42110 TIME_WAIT
tcp        0    132 tecmint.com:ssh    115.113.134.3.static-:64662 ESTABLISHED
tcp        0      0 tecmint.com:http   crawl-66-249-71-240.g:41166 TIME_WAIT
tcp        0      0 localhost.localdomain:54823 localhost.localdomain:smtp  TIME_WAIT
tcp        0      0 localhost.localdomain:54822 localhost.localdomain:smtp  TIME_WAIT
tcp        0      0 tecmint.com:http   sg2nlhg010.shr.prod.s:42091 TIME_WAIT
tcp        0      0 tecmint.com:http   sg2nlhg007.shr.prod.s:36998 TIME_WAIT

18. Finding non supportive Address

Finding un-configured address families with some useful information.
# netstat --verbose

netstat: no support for `AF IPX' on this system.
netstat: no support for `AF AX25' on this system.
netstat: no support for `AF X25' on this system.
netstat: no support for `AF NETROM' on this system.

19. Finding Listening Programs

Find out how many listening programs running on a port.
# netstat -ap | grep http

tcp        0      0 *:http                      *:*                         LISTEN      9056/httpd
tcp        0      0 *:https                     *:*                         LISTEN      9056/httpd
tcp        0      0 tecmint.com:http   sg2nlhg008.shr.prod.s:35248 TIME_WAIT   -
tcp        0      0 tecmint.com:http   sg2nlhg007.shr.prod.s:57783 TIME_WAIT   -
tcp        0      0 tecmint.com:http   sg2nlhg007.shr.prod.s:57769 TIME_WAIT   -
tcp        0      0 tecmint.com:http   sg2nlhg008.shr.prod.s:35270 TIME_WAIT   -
tcp        0      0 tecmint.com:http   sg2nlhg009.shr.prod.s:41637 TIME_WAIT   -
tcp        0      0 tecmint.com:http   sg2nlhg009.shr.prod.s:41614 TIME_WAIT   -
unix  2      [ ]         STREAM     CONNECTED     88586726 10394/httpd

20. Displaying RAW Network Statistics

# netstat --statistics --raw

Ip:
    62175683 total packets received
    52970 with invalid addresses
    0 forwarded
Icmp:
    875519 ICMP messages received
        destination unreachable: 901671
        echo request: 8
        echo replies: 16253
IcmpMsg:
        InType0: 83
IpExt:
    InMcastPkts: 117
That’s it, If you are looking for more information and options about netstat command, refer netstat manual docs or use man netstat command to know all the information. If we’ve missed anything in the list, please inform us using our comment section below. So, we could keep updating this list based on your comments.

Linux: Check Network Connection Command

How do I check network connections under Linux using command line options?

You need to use any one of the following tool or command under Linux to check network connections including their state, source/destination, and addresses and bandwidth usage etc:
  1. ss command: It dump socket (network connection) statistics such as all TCP / UDP connections, established connection per protocol (e.g., display all established ssh connections), display all the tcp sockets in various state such as ESTABLISHED or FIN-WAIT-1 and so on.
  2. netstat command: It can display network connections, routing tables, interfaces and much more.
  3. tcptrack and iftop commands: Displays information about TCP connections it sees on a network interface and display bandwidth usage on an interface by host respectively.

Display Currently Established, Closed, Orphaned and Waiting TCP sockets, enter:

# ss -s
Sample outputs:
Total: 529 (kernel 726)
TCP:   1403 (estab 286, closed 1099, orphaned 1, synrecv 0, timewait 1098/0), ports 774
Transport Total     IP        IPv6
*   726       -         -
RAW   0         0         0
UDP   27        13        14
TCP   304       298       6
INET   331       311       20
FRAG   0         0         0
Or you can use the netstat command as follows:
# netstat -s
Sample outputs:
Ip:
    102402748 total packets received
    3 with invalid addresses
    0 forwarded
    0 incoming packets discarded
    102192035 incoming packets delivered
    95627316 requests sent out
Icmp:
    6726 ICMP messages received
    167 input ICMP message failed.
    ICMP input histogram:
        destination unreachable: 2353
        timeout in transit: 4
        echo requests: 4329
    10323 ICMP messages sent
    0 ICMP messages failed
    ICMP output histogram:
        destination unreachable: 5994
        echo replies: 4329
IcmpMsg:
        InType3: 2353
        InType8: 4329
        InType11: 4
        OutType0: 4329
        OutType3: 5994
Tcp:
    839222 active connections openings
    2148984 passive connection openings
    1480 failed connection attempts
    1501 connection resets received
    281 connections established
    101263451 segments received
    94668430 segments send out
    9820 segments retransmited
    0 bad segments received.
    1982 resets sent
Udp:
    1024635 packets received
    18 packets to unknown port received.
    0 packet receive errors
    1024731 packets sent
TcpExt:
    592 invalid SYN cookies received
    396 resets received for embryonic SYN_RECV sockets
    2 packets pruned from receive queue because of socket buffer overrun
    3 ICMP packets dropped because they were out-of-window
    2166428 TCP sockets finished time wait in fast timer
    2773 time wait sockets recycled by time stamp
    11 packets rejects in established connections because of timestamp
    1223930 delayed acks sent
    298 delayed acks further delayed because of locked socket
    Quick ack mode was activated 263 times
    16413851 packets directly queued to recvmsg prequeue.
    627914668 packets directly received from backlog
    1146535624 packets directly received from prequeue
    43628505 packets header predicted
    10588802 packets header predicted and directly queued to user
    8646100 acknowledgments not containing data received
    44710342 predicted acknowledgments
    5 times recovered from packet loss due to fast retransmit
    596 times recovered from packet loss due to SACK data
    2 bad SACKs received
    Detected reordering 1 times using FACK
    Detected reordering 4 times using time stamp
    3 congestion windows fully recovered
    7 congestion windows partially recovered using Hoe heuristic
    TCPDSACKUndo: 44
    208 congestion windows recovered after partial ack
    2743 TCP data loss events
    190 timeouts after SACK recovery
    90 timeouts in loss state
    2268 fast retransmits
    220 forward retransmits
    3704 retransmits in slow start
    1318 other TCP timeouts
    TCPRenoRecoveryFail: 2
    98 sack retransmits failed
    226 packets collapsed in receive queue due to low socket buffer
    267 DSACKs sent for old packets
    1 DSACKs sent for out of order packets
    272 DSACKs received
    34 connections reset due to unexpected data
    184 connections reset due to early user close
    147 connections aborted due to timeout
IpExt:
    InBcastPkts: 10

Display All Open Network Ports

Use the ss command as follows:
# ss -l
Sample outputs:
Recv-Q Send-Q                          Local Address:Port                              Peer Address:Port
0      50                                  127.0.0.1:mysql                                        *:*
0      128                                 127.0.0.1:11211                                        *:*
0      128                                         *:sunrpc                                       *:*
0      128                                        :::www                                         :::*
0      128                                         *:55153                                        *:*
0      3                                  10.1.11.27:domain                                       *:*
0      3                               192.168.1.101:domain                                       *:*
0      3                                   127.0.0.1:domain                                       *:*
0      3                                          :::domain                                      :::*
0      128                                        :::ssh                                         :::*
0      128                                         *:ssh                                          *:*
0      128                                 127.0.0.1:ipp                                          *:*
0      128                                       ::1:ipp                                         :::*
0      128                                        :::afs3-callback                                     :::*
0      128                                         *:afs3-callback                                      *:*
0      100                                         *:smtp                                         *:*
0      128                                       ::1:953                                         :::*
0      128                                 127.0.0.1:953                                          *:*
0      5                                           *:8000                                         *:*
OR Use the netstat command as follows:
# netstat -tulpn
Sample outputs:
Active Internet connections (only servers)
Proto Recv-Q Send-Q Local Address           Foreign Address         State       PID/Program name
tcp        0      0 127.0.0.1:3306          0.0.0.0:*               LISTEN      1380/mysqld
tcp        0      0 127.0.0.1:11211         0.0.0.0:*               LISTEN      1550/memcached
tcp        0      0 0.0.0.0:111             0.0.0.0:*               LISTEN      936/portmap
tcp        0      0 0.0.0.0:55153           0.0.0.0:*               LISTEN      1025/rpc.statd
tcp        0      0 10.1.11.27:53           0.0.0.0:*               LISTEN      1343/named
tcp        0      0 192.168.1.101:53        0.0.0.0:*               LISTEN      1343/named
tcp        0      0 127.0.0.1:53            0.0.0.0:*               LISTEN      1343/named
tcp        0      0 0.0.0.0:22              0.0.0.0:*               LISTEN      979/sshd
tcp        0      0 127.0.0.1:631           0.0.0.0:*               LISTEN      1828/cupsd
tcp        0      0 0.0.0.0:7001            0.0.0.0:*               LISTEN      10129/transmission
tcp        0      0 0.0.0.0:25              0.0.0.0:*               LISTEN      1694/master
tcp        0      0 127.0.0.1:953           0.0.0.0:*               LISTEN      1343/named
tcp        0      0 0.0.0.0:8000            0.0.0.0:*               LISTEN      1539/icecast2
tcp6       0      0 :::80                   :::*                    LISTEN      1899/apache2
tcp6       0      0 :::53                   :::*                    LISTEN      1343/named
tcp6       0      0 :::22                   :::*                    LISTEN      979/sshd
tcp6       0      0 ::1:631                 :::*                    LISTEN      1828/cupsd
tcp6       0      0 :::7001                 :::*                    LISTEN      10129/transmission
tcp6       0      0 ::1:953                 :::*                    LISTEN      1343/named
udp        0      0 239.255.255.250:1900    0.0.0.0:*                           11937/opera
udp        0      0 0.0.0.0:111             0.0.0.0:*                           936/portmap
udp        0      0 0.0.0.0:777             0.0.0.0:*                           1025/rpc.statd
udp        0      0 0.0.0.0:38297           0.0.0.0:*                           1025/rpc.statd
udp        0      0 192.168.1.101:33843     0.0.0.0:*                           11937/opera
udp        0      0 10.1.11.27:53           0.0.0.0:*                           1343/named
udp        0      0 192.168.1.101:53        0.0.0.0:*                           1343/named
udp        0      0 127.0.0.1:53            0.0.0.0:*                           1343/named
udp        0      0 0.0.0.0:68              0.0.0.0:*                           5840/dhclient
udp        0      0 127.0.0.1:11211         0.0.0.0:*                           1550/memcached
udp        0      0 0.0.0.0:7001            0.0.0.0:*                           10129/transmission
udp        0      0 10.1.11.27:33372        0.0.0.0:*                           11937/opera
udp6       0      0 :::53                   :::*                                1343/named  

Display All TCP Sockets

Type the ss command as follows:
# ss -t -a
Or use the netstat command as follows:
# netstat -nat

Display All UDP Sockets

Type the ss command as follows:
# ss -u -a
Or use the netstat command as follows:
# netstat -nau

lsof Command

You can use the lsof command follows to list more information about open ports:
# lsof -i :portNumber
# lsof -i tcp:portNumber
# lsof -i udp:portNumber
# lsof -i :80 | grep LISTEN

View Established Connections Only

Use the netstat command as follows:
# netstat -natu | grep 'ESTABLISHED'

Say Hello To tcptrack

The tcptrack command displays the status of TCP connections that it sees on a given network interface. tcptrack monitors their state and displays information such as state, source/destination addresses and bandwidth usage in a sorted, updated list very much like the top command.
# tcptrack -i eth0
Sample outputs:
Fig.01: tcptrack in Action

See how to install and use the tcptrack tool under Linux for more information.

iftop command

The iftop command listens to network traffic on a given network interface such as eth0, and displays a table of current bandwidth usage by pairs of hosts:
# iftop -i eth1
It can display or analyses packet flowing in and out of the 192.168.1.0/24 network:
# iftop -F 192.168.1.0/24
Sample outputs:
Fig.02: iftop command in action

See how to install and use iftop command under Linux for more information.

Twitter Delicious Facebook Digg Stumbleupon Favorites More

 
Design by Free WordPress Themes | Bloggerized by Lasantha - Premium Blogger Themes | Powerade Coupons