Thursday, April 21, 2016

Facebook thử nghiệm tính năng quảng cáo trên NewsFeed

Facebook cho biết hãng đang tiến hành thử nghiệm một tính năng quảng cáo mới trên NewsFeed. Với tính năng này, các nhà quảng cáo sẽ được phép đăng quảng cáo trực tiếp lên NewsFeed của người dùng, bất chấp người dùng có muốn hay không.
Facebook cho biết: “Chúng tôi muốn cung cấp cho các nhà tiếp thị cơ hội quảng cáo trên News Feed – nơi hấp dẫn nhất trên Facebook”. Trước đây, các nhà tiếp thị có thể chạy các quảng cáo tiêu chuẩn ở cột phía bên tay phải – Sidebar hoặc mục Sponsored Stories của Facebook. Bắt đầu từ ngày 26/3, họ có thể đăng thêm các quảng cáo trực tiếp lên News Feed của người dùng thông qua các link liên kết.
facebook-ads-newsfeed
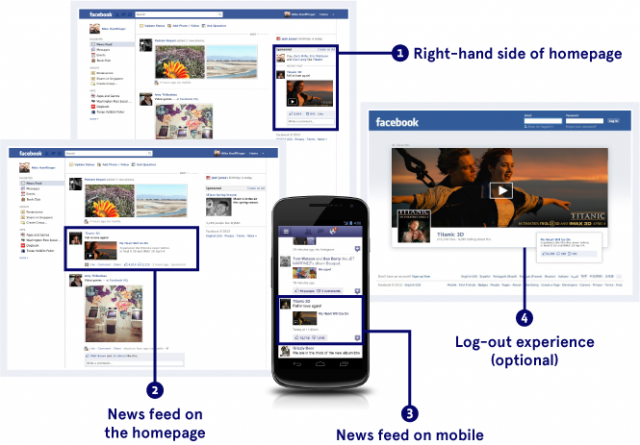
Được biết, dịch vụ mới sẽ được hiển thị dưới dạng Add-on của Facebook trên destop và phiên bản mobile. Hãng đang tiến hành thử nghiệm tính năng này cùng với các đối tác quảng cáo TellApart, MediaMath và Nanigans. Trong vài tuần tới, Facebook sẽ triển khai rộng khắp tính năng cũng như bắt tay với nhiều nhà tiếp thị khác.
Tính năng quảng cáo trên là một phần của công cụ quảng cáo Facebook Exchange (FBX) mà Facebook tung ra từ mùa thu năm ngoái. FBX là một hệ thống quảng cáo dựa trên nền tảng Demand Side Platforms (DSPs) cho phép các nhà quảng cáo tiếp thị tới khách hàng thông qua các dữ liệu lịch sử trực tuyến của họ. Công cụ này được Facebook tính theo hình thức giá trên mỗi một nghìn lần hiển thị. Mặc dù sẽ gây nhiều phiền toái tới người dùng, FBX hứa hẹn sẽ mang lại món hời lớn cho cả Facebook và các doanh nghiệp quảng cáo.
Để trấn an người dùng, Facebook cam kết sẽ không thay đổi tổng số lượng quảng cáo hiển thị trên trang tài khoản của họ, bao gồm cả các quảng cáo phía bên tay phải và quảng cáo liên kết trên News Feed. Trước đó, hãng cũng đưa ra những thay đổi nhỏ về giao diện News Feed và Timeline để tăng thêm tính tương tác đối với người dùng.
fb-newsfeed-ad-bigger
Facebook đang lao vào thị trường quảng cáo trực tuyến bằng các chiến dịch thúc đẩy tiếp thị từng bước nhằm khai thác lợi thế mạng xã hội lớn nhất của họ. Tuy nhiên, nếu không cân bằng được quyền lợi của công ty với lợi ích của người dùng, Facebook rất có thể phải hứng chịu hậu quả nặng nề nếu làn sóng tẩy chay trang mạng này lan rộng.
Facebook ra mắt công cụ quảng cáo “truy lùng” khách hàng tương đồng
Facebook đã công bố ra mắt tính năng “lookalike audiences” (tạm dịch: người dùng giống nhau), một lựa chọn quảng cáo mới cho phép các công ty quảng cáo tiếp cận với những người dùng có đặc điểm giống như khách hàng hiện thời của mình.
Theo trang công nghệ Cnet, công cụ tìm kiếm đối tượng quảng cáo, vốn được Facebook thử nghiệm với một vài công ty quảng cáo trong vài tuần vừa qua, đã đưa hệ thống lựa chọn đối tượng quảng cáo của mạng xã hội này lên một tầm cao mới. Các công ty quảng cáo giờ đã có thể lựa chọn ra các đối tượng quảng cáo một cách thông minh hơn trước.
Trước đây, trên Facebook, các mẫu quảng cáo được đưa tới tay các khách hàng mà một công ty đã có từ trước. “Với lookalike audience, Facebook có thể sử dụng sở thích hoặc đặc điểm nhân trắc học để đưa các mẫu quảng cáo đến với những người có đặc điểm giống như các khách hàng hiện tại của mình”, theo một bài viết trên blog của công ty.
Theo mạng xã hội này, công cụ quảng cáo nói trên sẽ đến tay các công ty quảng cáo vào cuối tuần này.
Facebook ép quảng cáo video tự bật cho người dùng
Giới truyền thông vừa tiết lộ rằng hiện nay, Facebook đang bắt tay với một số hãng marketing nhằm đưa loại quảng cáo video tới timeline của người dùng. Điểm đáng chú ý trong kế hoạch trên là những quảng cáo video sẽ “tự động bật và hiện diện trong một trình chơi video mở rộng trên cả phần news feed chính cũng như bao phủ các khoảng bên trái và phải của màn hình.”
Với thông tin trên, dường như Facebook đang muốn “thử” độ kiên nhẫn của người dùng bằng những động thái “bành trướng” gây tức giận, chẳng hạn như ứng dụng Facebook Home vừa tạo ra rất nhiều tranh cãi.
Theo giới truyền thông thì Facebook đang hy vọng có thể kiếm được hơn 4 triệu USD mỗi ngày chỉ bằng việc triển khai loại hình quảng cáo video kiểu mới như trên.  Tất nhiên, nếu không tính tới phản ứng người dùng thì mạng xã hội lớn nhất thế giới hoàn toàn có thể tự tay “xua đuổi” cộng đồng thành viên của họ chỉ vì quá ham mê…kiếm tiền./.

Thursday, April 14, 2016

Find number of unique IP’s and active connections to Web server

In computing, netstat (network statistics) is a command-line tool that displays network connections (both incoming and outgoing), routing tables, and a number of network interface (network interface controller or software-defined network interface) and network protocol statistics. It is available on Unix-like operating systems including OS X, Linux, Solaris, and BSD, and is available on Windows NT-based operating systems including Windows XP, Windows Vista, Windows 7 and Windows 8. Find number Unique IP's and active connections to Web server - blackMORE Ops
It is used for finding problems in the network and to determine the amount of traffic on the network as a performance measurement.
netstat is the most frequent tool used for monitoring network connections on a Linux servers. netstat returns a variety of information on active connections such as their current status, what hosts are involved, and which programs are involved. You can also see information about the routing table and even get statistics on your network interfaces. netstat is a good all-around utility and it is an essential tool for the Linux administrators.
If you just type netstat, it would display a long list of information that’s usually more than you want to go through at any given time. The trick is that how to keeping the information useful and what you’re looking for and how to tell netstat to only display that information.
Users can also use man netstat command to get detailed netstat help and manual where there are lots of configurable options and flags to get meaningful lists and results.

The Holy Grail of netstat – My way

My requirements are simple:
  1. I want to see all users connected to my server
  2. I only want to see users on port 80 (http)
  3. I want to see total number of connections per IP
  4. I don’t want to see my own server’s IP in the output
  5. I want to sort them Max to Min.
Following commands will do just that. I am using the usual netstatty things. I will break down each command as I go:

Step 1: Show active connections – TCP and UDP Internet  (w/o servers)

First of all lets just check the active TCP and UDP connections.
netstat -ntu
-ntu = TCP and UDP connections in numeric order (w/o servers).

Step 2: Show all active connections – (/w servers and established)

Well, that’s good. But how do I know what ports I am listening to? I need that cause I want to check that my server is not listening to any funky ports. If it does, then I got either mis-configured services or my server is compromised.
So I will just add ‘ -a ‘ flag in this command.
netstat -antu
-antu = All TCP and UDP connections in numeric order (with servers and established)
I’ve seen way too many guides where people go an use ‘ plan ‘ flag .. ‘ -a ‘ already includes everything, ‘ -l ‘ is not required.

Step 3: Show all active connections to Web server

Now that I have a decent output, I can start working on it. In this particular output, I got all sorts active TCP and UDP Internet connections on every open port. I want to narrow it down to port 80 only (HTTP Port). I will use grep to narrow down on that.
netstat -antu | grep :80
Nice, now I see active TCP and UDP Internet connections on port 80 only. (in fact it will be all TCP as HTTP is a TCP service). You can use netstat -anu to list UDP connections.

Step 4: Show all active connections to Web server excluding self IP’s

So far I managed to list all active TCP and UDP connections and filter my results for port 80. But I can see few entries like following:
tcp        0      0 0.0.0.0:80                  0.0.0.0:*                   LISTEN      
tcp        0      0 :::80                       :::*                        LISTEN
I don’t want to exclude that as it is just loopback address. I am more interested to see foreign IP’s connected to my website. So I will just use grep -v to exclude these connections.
netstat -antu | grep :80 | grep -v LISTEN

>> Sample output

root@kali [~]# netstat -antu | grep :80 | grep -v LISTEN 
tcp        0      0 127.0.0.1:80             202.28.177.61:59818         SYN_RECV    
tcp        0      0 127.0.0.1:80             202.28.177.61:40560         SYN_RECV    
tcp        0      0 127.0.0.1:80             202.28.177.61:50523         SYN_RECV    
tcp        0      0 127.0.0.1:80             202.28.177.61:55520         SYN_RECV    
tcp        0      0 127.0.0.1:80             68.204.187.5:50420          TIME_WAIT   
tcp        0      0 127.0.0.1:80             202.28.177.61:41423         TIME_WAIT   
tcp        0      0 127.0.0.1:80             24.232.175.224:45254        TIME_WAIT   
tcp        0      0 127.0.0.1:80             68.204.187.5:50465          TIME_WAIT   
tcp        0      0 127.0.0.1:80             202.28.177.61:43653         TIME_WAIT   
tcp        0      0 127.0.0.1:80             202.28.177.61:33851         TIME_WAIT

Step 5: Show all active connections to Web server – IP: Port only

Now I want to do more. I want to exclude everything and only list foreign IP addresses. I need some sort of filter. awk is exactly the tool I need to use here. But how do I know which field to filter?
Let’s look at a sample output from previous command.
tcp        0      0 127.0.0.1:80             202.28.177.61:59818         SYN_RECV
In the above line, I am only interested on the foreign IP 202.28.177.61. awk has the capability to do data extraction. Let’s count the fields.
(1)tcp    (2)0    (3)0  (4)127.0.0.1:80   (5)202.28.177.61:59818         (6)SYN_RECV
Note that, 127.0.0.1:80 and 202.28.177.61:59818 is counted as one field as they don’t have any spaces.
So, let’s try to list the 5th field which contains all the foreign IP addresses.
netstat -antu | grep :80 | grep -v LISTEN | awk '{print $5}'

>> Sample output

root@kali [~]# netstat -antu | grep :80 | grep -v LISTEN | awk '{print $5}' 
113.173.16.70:26985
50.106.33.249:49292
113.173.16.70:26982
66.87.131.102:4370
113.173.16.70:26996
175.143.49.222:19709
66.87.131.102:4386
87.76.5.167:18296
23.24.156.251:57306
222.66.184.182:56000

Step 6: Show all active connections to Web server – IP’s only

The last output looks good to me. I managed to list only foreign addresses. But If you look closely, you will see same foreign IP is listed more than once on different ports. It is essentially the same user (or groups of users behind same proxy).
Let’s go one step further, I now want to see foreign IP’s only without their originating ports. I will be using cut for that. cut will allow me to cut every line at the first space character and take the first piece.
netstat -antu | grep :80 | grep -v LISTEN | awk '{print $5}' | cut -d: -f1
I am using -d: to let cut know that I am using the (:) colon character as the field delimiter.
By using -f1 I am telling cut to give me the first field (which is the IP address before the colon character).

>> Sample output

root@kali [~]# netstat -antu | grep :80 | grep -v LISTEN | awk '{print $5}' | cut -d: -f1  
99.104.23.221
99.104.23.221
2.50.116.13
5.239.12.118
99.104.23.221
99.104.23.221
66.249.81.52
99.104.23.221
218.80.192.208
99.104.23.221

Step 7: Show all active connections to Web server – sorted and unique

Now the output contains only foreign IP addresses. We now need to sort them, and then pipe it to uniq command so that we are left with unique foreign IP in a sorted manner. I also want uniq command to count the number of connections per IP.
netstat -antu | grep :80 | grep -v LISTEN | awk '{print $5}' | cut -d: -f1 | sort | uniq -c
uniq -c will count total number of connections per IP.

>> Sample output

root@kali [~]# netstat -antu | grep :80 | grep -v LISTEN | awk '{print $5}' | cut -d: -f1 | sort | uniq -c
     14 112.204.9.125
      1 113.173.16.70
      4 124.176.50.119
      1 125.163.235.42
      1 175.136.237.182
      1 178.26.19.53
      1 180.76.6.44
     12 202.28.177.61

Step 8: Show all active connections to Web server – connection count

But hang on, uniq -c did count it and sorted them as per IP addresses. Let’s re-sort this list to show Max to Min number of connections per unique IP (foreign IP’s only).
netstat -antu | grep :80 | grep -v LISTEN | awk '{print $5}' | cut -d: -f1 | sort | uniq -c | sort -rn

>> Sample output

root@kali [~]# netstat -ntu | grep :80 | grep -v LISTEN | awk '{print $5}' | cut -d: -f1 | sort | uniq -c | sort -rn 
     44 92.45.59.194
     37 121.52.153.215
     35 212.14.31.37
     28 76.177.223.119
     28 37.228.105.222
     27 182.186.25.222
      8 13.1.89.53
      6 127.0.0.1

Step 9: Show all active connections to Web server – exclude self IP’s

It’s all good so far. But I can see my own server’s IP in that list. (i.e. 127.0.0.1). If I can just exclude that, I will be left with Foreign IP’s only. I will use grep -v to exclude that line.
root@kali [~]# netstat -ntu | grep :80 | grep -v LISTEN | awk '{print $5}' | cut -d: -f1 | sort | uniq -c | sort -rn | grep -v 127.0.0.1

>> Sample output

root@kali [~]# netstat -ntu | grep :80 | grep -v LISTEN | awk '{print $5}' | cut -d: -f1 | sort | uniq -c | sort -rn | grep -v 127.0.0.1
     45 108.168.173.83
     36 174.45.176.119
     35 70.39.187.230
     34 175.144.92.225
     24 139.195.97.102
     19 69.142.186.97
     18 150.101.190.51
     12 50.150.246.167

Step 10: Final count of all active IP’s to Web server

This is now working just the way I wanted. Let’s do a final count of total number of unique IP’s connected to my server.
root@kali [~]# netstat -ntu | grep :80 | grep -v LISTEN | awk '{print $5}' | cut -d: -f1 | sort | uniq -c | sort -rn | grep -v 127.0.0.1 | wc -l

>> Sample output

root@kali [~]# netstat -ntu | grep :80 | grep -v LISTEN | awk '{print $5}' | cut -d: -f1 | sort | uniq -c | sort -rn | grep -v 127.0.0.1 | wc -l
768
wc -l does a line count..
It means I’ve got 768 unique IP’s connected right now.

Step 11: Final count of all active connections to Web server

Last but not the least, I want a total count of connections to port 80 from all foreign IP’s.
netstat -ntu | grep :80 | grep -v LISTEN | awk '{print $5}' | cut -d: -f1 | grep -v 127.0.0.1 | wc -l

>> Sample output

root@kali [~]# netstat -ntu | grep :80 | grep -v LISTEN | awk '{print $5}' | cut -d: -f1 | grep -v 127.0.0.1 | wc -l
1847
That means I’ve got 1847 connections opened right now from all external IP’s to port 80 on my server.

Conclusion

netstat is the most useful tool to detect and determine whether a server is under DoS or DDoS attack (Distributed Denial of Service). Whenever a client connects to a server via network, a connection is established and opened on the system. On a busy high load server, the number of connections connected to the server can be run into large amount till hundreds if not thousands. Find out and get a list of connections on the server by each node, client or IP address is useful for system scaling planning, and in most cases, detect and determine whether a web server is under DoS or DDoS attack (Distributed Denial of Service), where an IP sends large amount of connections to the server. To check connection numbers on the server, administrators and webmasters can make use of netstat command.
Do I think my way of using netstat is the best? Absolutely! Why? Cause it always worked for me.
I don’t know whether your sever is running on port 80 or if you’re getting DDoS on a different port (i.e. port 25 or 443), but the above command serves my purpose every time. There’s 10 different ways to skin a cat and I like my way. I’ve broken down my way of using netstat command to the last straw and once you follow it from top to bottom, you will get used to it and in time you will find your own perfect command.
There is no best way, only the way that works for you.

Further helpful links, sources and references:

Following links are awesome and they have lots of examples on how to use netstat. Though they might not be very explanatory, but if you understand the basics, then they are a useful resource to have on netstat.
  1. Netstat on Wiki
  2. The Geek Stuff
  3. My Digital Life
  4. BinaryTides

20 Netstat Commands for Linux Network Management

netstat (network statistics) is a command line tool for monitoring network connections both incoming and outgoing as well as viewing routing tables, interface statistics etc. netstat is available on all Unix-like Operating Systems and also available on Windows OS as well. It is very useful in terms of network troubleshooting and performance measurement. netstat is one of the most basic network service debugging tools, telling you what ports are open and whether any programs are listening on ports.
Linux Netstat Command
This tool is very important and much useful for Linux network administrators as well as system administrators to monitor and troubleshoot their network related problems and determine network traffic performance. This article shows usages of netstat command with their examples which may be useful in daily operation.

You might also be interested in following article
  1. 35 Practical Examples of Linux Find Command

1. Listing all the LISTENING Ports of TCP and UDP connections

Listing all ports (both TCP and UDP) using netstat -a option.
# netstat -a | more

Active Internet connections (servers and established)
Proto Recv-Q Send-Q Local Address               Foreign Address             State
tcp        0      0 *:sunrpc                    *:*                         LISTEN
tcp        0     52 192.168.0.2:ssh             192.168.0.1:egs             ESTABLISHED
tcp        1      0 192.168.0.2:59292           www.gov.com:http            CLOSE_WAIT
tcp        0      0 localhost:smtp              *:*                         LISTEN
tcp        0      0 *:59482                     *:*                         LISTEN
udp        0      0 *:35036                     *:*
udp        0      0 *:npmp-local                *:*

Active UNIX domain sockets (servers and established)
Proto RefCnt Flags       Type       State         I-Node Path
unix  2      [ ACC ]     STREAM     LISTENING     16972  /tmp/orbit-root/linc-76b-0-6fa08790553d6
unix  2      [ ACC ]     STREAM     LISTENING     17149  /tmp/orbit-root/linc-794-0-7058d584166d2
unix  2      [ ACC ]     STREAM     LISTENING     17161  /tmp/orbit-root/linc-792-0-546fe905321cc
unix  2      [ ACC ]     STREAM     LISTENING     15938  /tmp/orbit-root/linc-74b-0-415135cb6aeab

2. Listing TCP Ports connections

Listing only TCP (Transmission Control Protocol) port connections using netstat -at.
# netstat -at

Active Internet connections (servers and established)
Proto Recv-Q Send-Q Local Address               Foreign Address             State
tcp        0      0 *:ssh                       *:*                         LISTEN
tcp        0      0 localhost:ipp               *:*                         LISTEN
tcp        0      0 localhost:smtp              *:*                         LISTEN
tcp        0     52 192.168.0.2:ssh             192.168.0.1:egs             ESTABLISHED
tcp        1      0 192.168.0.2:59292           www.gov.com:http            CLOSE_WAIT

3. Listing UDP Ports connections

Listing only UDP (User Datagram Protocol ) port connections using netstat -au.
# netstat -au

Active Internet connections (servers and established)
Proto Recv-Q Send-Q Local Address               Foreign Address             State
udp        0      0 *:35036                     *:*
udp        0      0 *:npmp-local                *:*
udp        0      0 *:mdns                      *:*

4. Listing all LISTENING Connections

Listing all active listening ports connections with netstat -l.
# netstat -l

Active Internet connections (only servers)
Proto Recv-Q Send-Q Local Address               Foreign Address             State
tcp        0      0 *:sunrpc                    *:*                         LISTEN
tcp        0      0 *:58642                     *:*                         LISTEN
tcp        0      0 *:ssh                       *:*                         LISTEN
udp        0      0 *:35036                     *:*
udp        0      0 *:npmp-local                *:*

Active UNIX domain sockets (only servers)
Proto RefCnt Flags       Type       State         I-Node Path
unix  2      [ ACC ]     STREAM     LISTENING     16972  /tmp/orbit-root/linc-76b-0-6fa08790553d6
unix  2      [ ACC ]     STREAM     LISTENING     17149  /tmp/orbit-root/linc-794-0-7058d584166d2
unix  2      [ ACC ]     STREAM     LISTENING     17161  /tmp/orbit-root/linc-792-0-546fe905321cc
unix  2      [ ACC ]     STREAM     LISTENING     15938  /tmp/orbit-root/linc-74b-0-415135cb6aeab

5. Listing all TCP Listening Ports

Listing all active listening TCP ports by using option netstat -lt.
# netstat -lt

Active Internet connections (only servers)
Proto Recv-Q Send-Q Local Address               Foreign Address             State
tcp        0      0 *:dctp                      *:*                         LISTEN
tcp        0      0 *:mysql                     *:*                         LISTEN
tcp        0      0 *:sunrpc                    *:*                         LISTEN
tcp        0      0 *:munin                     *:*                         LISTEN
tcp        0      0 *:ftp                       *:*                         LISTEN
tcp        0      0 localhost.localdomain:ipp   *:*                         LISTEN
tcp        0      0 localhost.localdomain:smtp  *:*                         LISTEN
tcp        0      0 *:http                      *:*                         LISTEN
tcp        0      0 *:ssh                       *:*                         LISTEN
tcp        0      0 *:https                     *:*                         LISTEN

6. Listing all UDP Listening Ports

Listing all active listening UDP ports by using option netstat -lu.
# netstat -lu

Active Internet connections (only servers)
Proto Recv-Q Send-Q Local Address               Foreign Address             State
udp        0      0 *:39578                     *:*
udp        0      0 *:meregister                *:*
udp        0      0 *:vpps-qua                  *:*
udp        0      0 *:openvpn                   *:*
udp        0      0 *:mdns                      *:*
udp        0      0 *:sunrpc                    *:*
udp        0      0 *:ipp                       *:*
udp        0      0 *:60222                     *:*
udp        0      0 *:mdns                      *:*

7. Listing all UNIX Listening Ports

Listing all active UNIX listening ports using netstat -lx.
# netstat -lx

Active UNIX domain sockets (only servers)
Proto RefCnt Flags       Type       State         I-Node Path
unix  2      [ ACC ]     STREAM     LISTENING     4171   @ISCSIADM_ABSTRACT_NAMESPACE
unix  2      [ ACC ]     STREAM     LISTENING     5767   /var/run/cups/cups.sock
unix  2      [ ACC ]     STREAM     LISTENING     7082   @/tmp/fam-root-
unix  2      [ ACC ]     STREAM     LISTENING     6157   /dev/gpmctl
unix  2      [ ACC ]     STREAM     LISTENING     6215   @/var/run/hald/dbus-IcefTIUkHm
unix  2      [ ACC ]     STREAM     LISTENING     6038   /tmp/.font-unix/fs7100
unix  2      [ ACC ]     STREAM     LISTENING     6175   /var/run/avahi-daemon/socket
unix  2      [ ACC ]     STREAM     LISTENING     4157   @ISCSID_UIP_ABSTRACT_NAMESPACE
unix  2      [ ACC ]     STREAM     LISTENING     60835836 /var/lib/mysql/mysql.sock
unix  2      [ ACC ]     STREAM     LISTENING     4645   /var/run/audispd_events
unix  2      [ ACC ]     STREAM     LISTENING     5136   /var/run/dbus/system_bus_socket
unix  2      [ ACC ]     STREAM     LISTENING     6216   @/var/run/hald/dbus-wsUBI30V2I
unix  2      [ ACC ]     STREAM     LISTENING     5517   /var/run/acpid.socket
unix  2      [ ACC ]     STREAM     LISTENING     5531   /var/run/pcscd.comm

8. Showing Statistics by Protocol

Displays statistics by protocol. By default, statistics are shown for the TCP, UDP, ICMP, and IP protocols. The -s parameter can be used to specify a set of protocols.
# netstat -s

Ip:
    2461 total packets received
    0 forwarded
    0 incoming packets discarded
    2431 incoming packets delivered
    2049 requests sent out
Icmp:
    0 ICMP messages received
    0 input ICMP message failed.
    ICMP input histogram:
    1 ICMP messages sent
    0 ICMP messages failed
    ICMP output histogram:
        destination unreachable: 1
Tcp:
    159 active connections openings
    1 passive connection openings
    4 failed connection attempts
    0 connection resets received
    1 connections established
    2191 segments received
    1745 segments send out
    24 segments retransmited
    0 bad segments received.
    4 resets sent
Udp:
    243 packets received
    1 packets to unknown port received.
    0 packet receive errors
    281 packets sent

9. Showing Statistics by TCP Protocol

Showing statistics of only TCP protocol by using option netstat -st.
# netstat -st

Tcp:
    2805201 active connections openings
    1597466 passive connection openings
    1522484 failed connection attempts
    37806 connection resets received
    1 connections established
    57718706 segments received
    64280042 segments send out
    3135688 segments retransmited
    74 bad segments received.
    17580 resets sent

10. Showing Statistics by UDP Protocol

# netstat -su

Udp:
    1774823 packets received
    901848 packets to unknown port received.
    0 packet receive errors
    2968722 packets sent

11. Displaying Service name with PID

Displaying service name with their PID number, using option netstat -tp will display “PID/Program Name”.
# netstat -tp

Active Internet connections (w/o servers)
Proto Recv-Q Send-Q Local Address               Foreign Address             State       PID/Program name
tcp        0      0 192.168.0.2:ssh             192.168.0.1:egs             ESTABLISHED 2179/sshd
tcp        1      0 192.168.0.2:59292           www.gov.com:http            CLOSE_WAIT  1939/clock-applet

12. Displaying Promiscuous Mode

Displaying Promiscuous mode with -ac switch, netstat print the selected information or refresh screen every five second. Default screen refresh in every second.
# netstat -ac 5 | grep tcp

tcp        0      0 *:sunrpc                    *:*                         LISTEN
tcp        0      0 *:58642                     *:*                         LISTEN
tcp        0      0 *:ssh                       *:*                         LISTEN
tcp        0      0 localhost:ipp               *:*                         LISTEN
tcp        0      0 localhost:smtp              *:*                         LISTEN
tcp        1      0 192.168.0.2:59447           www.gov.com:http            CLOSE_WAIT
tcp        0     52 192.168.0.2:ssh             192.168.0.1:egs             ESTABLISHED
tcp        0      0 *:sunrpc                    *:*                         LISTEN
tcp        0      0 *:ssh                       *:*                         LISTEN
tcp        0      0 localhost:ipp               *:*                         LISTEN
tcp        0      0 localhost:smtp              *:*                         LISTEN
tcp        0      0 *:59482                     *:*                         LISTEN

13. Displaying Kernel IP routing

Display Kernel IP routing table with netstat and route command.
# netstat -r

Kernel IP routing table
Destination     Gateway         Genmask         Flags   MSS Window  irtt Iface
192.168.0.0     *               255.255.255.0   U         0 0          0 eth0
link-local      *               255.255.0.0     U         0 0          0 eth0
default         192.168.0.1     0.0.0.0         UG        0 0          0 eth0

14. Showing Network Interface Transactions

Showing network interface packet transactions including both transferring and receiving packets with MTU size.
# netstat -i

Kernel Interface table
Iface       MTU Met    RX-OK RX-ERR RX-DRP RX-OVR    TX-OK TX-ERR TX-DRP TX-OVR Flg
eth0       1500   0     4459      0      0      0     4057      0      0      0 BMRU
lo        16436   0        8      0      0      0        8      0      0      0 LRU

15. Showing Kernel Interface Table

Showing Kernel interface table, similar to ifconfig command.
# netstat -ie

Kernel Interface table
eth0      Link encap:Ethernet  HWaddr 00:0C:29:B4:DA:21
          inet addr:192.168.0.2  Bcast:192.168.0.255  Mask:255.255.255.0
          inet6 addr: fe80::20c:29ff:feb4:da21/64 Scope:Link
          UP BROADCAST RUNNING MULTICAST  MTU:1500  Metric:1
          RX packets:4486 errors:0 dropped:0 overruns:0 frame:0
          TX packets:4077 errors:0 dropped:0 overruns:0 carrier:0
          collisions:0 txqueuelen:1000
          RX bytes:2720253 (2.5 MiB)  TX bytes:1161745 (1.1 MiB)
          Interrupt:18 Base address:0x2000

lo        Link encap:Local Loopback
          inet addr:127.0.0.1  Mask:255.0.0.0
          inet6 addr: ::1/128 Scope:Host
          UP LOOPBACK RUNNING  MTU:16436  Metric:1
          RX packets:8 errors:0 dropped:0 overruns:0 frame:0
          TX packets:8 errors:0 dropped:0 overruns:0 carrier:0
          collisions:0 txqueuelen:0
          RX bytes:480 (480.0 b)  TX bytes:480 (480.0 b)

16. Displaying IPv4 and IPv6 Information

Displays multicast group membership information for both IPv4 and IPv6.
# netstat -g

IPv6/IPv4 Group Memberships
Interface       RefCnt Group
--------------- ------ ---------------------
lo              1      all-systems.mcast.net
eth0            1      224.0.0.251
eth0            1      all-systems.mcast.net
lo              1      ff02::1
eth0            1      ff02::202
eth0            1      ff02::1:ffb4:da21
eth0            1      ff02::1

17. Print Netstat Information Continuously

To get netstat information every few second, then use the following command, it will print netstat information continuously, say every few seconds.
# netstat -c

Active Internet connections (w/o servers)
Proto Recv-Q Send-Q Local Address               Foreign Address             State
tcp        0      0 tecmint.com:http   sg2nlhg007.shr.prod.s:36944 TIME_WAIT
tcp        0      0 tecmint.com:http   sg2nlhg010.shr.prod.s:42110 TIME_WAIT
tcp        0    132 tecmint.com:ssh    115.113.134.3.static-:64662 ESTABLISHED
tcp        0      0 tecmint.com:http   crawl-66-249-71-240.g:41166 TIME_WAIT
tcp        0      0 localhost.localdomain:54823 localhost.localdomain:smtp  TIME_WAIT
tcp        0      0 localhost.localdomain:54822 localhost.localdomain:smtp  TIME_WAIT
tcp        0      0 tecmint.com:http   sg2nlhg010.shr.prod.s:42091 TIME_WAIT
tcp        0      0 tecmint.com:http   sg2nlhg007.shr.prod.s:36998 TIME_WAIT

18. Finding non supportive Address

Finding un-configured address families with some useful information.
# netstat --verbose

netstat: no support for `AF IPX' on this system.
netstat: no support for `AF AX25' on this system.
netstat: no support for `AF X25' on this system.
netstat: no support for `AF NETROM' on this system.

19. Finding Listening Programs

Find out how many listening programs running on a port.
# netstat -ap | grep http

tcp        0      0 *:http                      *:*                         LISTEN      9056/httpd
tcp        0      0 *:https                     *:*                         LISTEN      9056/httpd
tcp        0      0 tecmint.com:http   sg2nlhg008.shr.prod.s:35248 TIME_WAIT   -
tcp        0      0 tecmint.com:http   sg2nlhg007.shr.prod.s:57783 TIME_WAIT   -
tcp        0      0 tecmint.com:http   sg2nlhg007.shr.prod.s:57769 TIME_WAIT   -
tcp        0      0 tecmint.com:http   sg2nlhg008.shr.prod.s:35270 TIME_WAIT   -
tcp        0      0 tecmint.com:http   sg2nlhg009.shr.prod.s:41637 TIME_WAIT   -
tcp        0      0 tecmint.com:http   sg2nlhg009.shr.prod.s:41614 TIME_WAIT   -
unix  2      [ ]         STREAM     CONNECTED     88586726 10394/httpd

20. Displaying RAW Network Statistics

# netstat --statistics --raw

Ip:
    62175683 total packets received
    52970 with invalid addresses
    0 forwarded
Icmp:
    875519 ICMP messages received
        destination unreachable: 901671
        echo request: 8
        echo replies: 16253
IcmpMsg:
        InType0: 83
IpExt:
    InMcastPkts: 117
That’s it, If you are looking for more information and options about netstat command, refer netstat manual docs or use man netstat command to know all the information. If we’ve missed anything in the list, please inform us using our comment section below. So, we could keep updating this list based on your comments.

Linux: Check Network Connection Command

How do I check network connections under Linux using command line options?

You need to use any one of the following tool or command under Linux to check network connections including their state, source/destination, and addresses and bandwidth usage etc:
  1. ss command: It dump socket (network connection) statistics such as all TCP / UDP connections, established connection per protocol (e.g., display all established ssh connections), display all the tcp sockets in various state such as ESTABLISHED or FIN-WAIT-1 and so on.
  2. netstat command: It can display network connections, routing tables, interfaces and much more.
  3. tcptrack and iftop commands: Displays information about TCP connections it sees on a network interface and display bandwidth usage on an interface by host respectively.

Display Currently Established, Closed, Orphaned and Waiting TCP sockets, enter:

# ss -s
Sample outputs:
Total: 529 (kernel 726)
TCP:   1403 (estab 286, closed 1099, orphaned 1, synrecv 0, timewait 1098/0), ports 774
Transport Total     IP        IPv6
*   726       -         -
RAW   0         0         0
UDP   27        13        14
TCP   304       298       6
INET   331       311       20
FRAG   0         0         0
Or you can use the netstat command as follows:
# netstat -s
Sample outputs:
Ip:
    102402748 total packets received
    3 with invalid addresses
    0 forwarded
    0 incoming packets discarded
    102192035 incoming packets delivered
    95627316 requests sent out
Icmp:
    6726 ICMP messages received
    167 input ICMP message failed.
    ICMP input histogram:
        destination unreachable: 2353
        timeout in transit: 4
        echo requests: 4329
    10323 ICMP messages sent
    0 ICMP messages failed
    ICMP output histogram:
        destination unreachable: 5994
        echo replies: 4329
IcmpMsg:
        InType3: 2353
        InType8: 4329
        InType11: 4
        OutType0: 4329
        OutType3: 5994
Tcp:
    839222 active connections openings
    2148984 passive connection openings
    1480 failed connection attempts
    1501 connection resets received
    281 connections established
    101263451 segments received
    94668430 segments send out
    9820 segments retransmited
    0 bad segments received.
    1982 resets sent
Udp:
    1024635 packets received
    18 packets to unknown port received.
    0 packet receive errors
    1024731 packets sent
TcpExt:
    592 invalid SYN cookies received
    396 resets received for embryonic SYN_RECV sockets
    2 packets pruned from receive queue because of socket buffer overrun
    3 ICMP packets dropped because they were out-of-window
    2166428 TCP sockets finished time wait in fast timer
    2773 time wait sockets recycled by time stamp
    11 packets rejects in established connections because of timestamp
    1223930 delayed acks sent
    298 delayed acks further delayed because of locked socket
    Quick ack mode was activated 263 times
    16413851 packets directly queued to recvmsg prequeue.
    627914668 packets directly received from backlog
    1146535624 packets directly received from prequeue
    43628505 packets header predicted
    10588802 packets header predicted and directly queued to user
    8646100 acknowledgments not containing data received
    44710342 predicted acknowledgments
    5 times recovered from packet loss due to fast retransmit
    596 times recovered from packet loss due to SACK data
    2 bad SACKs received
    Detected reordering 1 times using FACK
    Detected reordering 4 times using time stamp
    3 congestion windows fully recovered
    7 congestion windows partially recovered using Hoe heuristic
    TCPDSACKUndo: 44
    208 congestion windows recovered after partial ack
    2743 TCP data loss events
    190 timeouts after SACK recovery
    90 timeouts in loss state
    2268 fast retransmits
    220 forward retransmits
    3704 retransmits in slow start
    1318 other TCP timeouts
    TCPRenoRecoveryFail: 2
    98 sack retransmits failed
    226 packets collapsed in receive queue due to low socket buffer
    267 DSACKs sent for old packets
    1 DSACKs sent for out of order packets
    272 DSACKs received
    34 connections reset due to unexpected data
    184 connections reset due to early user close
    147 connections aborted due to timeout
IpExt:
    InBcastPkts: 10

Display All Open Network Ports

Use the ss command as follows:
# ss -l
Sample outputs:
Recv-Q Send-Q                          Local Address:Port                              Peer Address:Port
0      50                                  127.0.0.1:mysql                                        *:*
0      128                                 127.0.0.1:11211                                        *:*
0      128                                         *:sunrpc                                       *:*
0      128                                        :::www                                         :::*
0      128                                         *:55153                                        *:*
0      3                                  10.1.11.27:domain                                       *:*
0      3                               192.168.1.101:domain                                       *:*
0      3                                   127.0.0.1:domain                                       *:*
0      3                                          :::domain                                      :::*
0      128                                        :::ssh                                         :::*
0      128                                         *:ssh                                          *:*
0      128                                 127.0.0.1:ipp                                          *:*
0      128                                       ::1:ipp                                         :::*
0      128                                        :::afs3-callback                                     :::*
0      128                                         *:afs3-callback                                      *:*
0      100                                         *:smtp                                         *:*
0      128                                       ::1:953                                         :::*
0      128                                 127.0.0.1:953                                          *:*
0      5                                           *:8000                                         *:*
OR Use the netstat command as follows:
# netstat -tulpn
Sample outputs:
Active Internet connections (only servers)
Proto Recv-Q Send-Q Local Address           Foreign Address         State       PID/Program name
tcp        0      0 127.0.0.1:3306          0.0.0.0:*               LISTEN      1380/mysqld
tcp        0      0 127.0.0.1:11211         0.0.0.0:*               LISTEN      1550/memcached
tcp        0      0 0.0.0.0:111             0.0.0.0:*               LISTEN      936/portmap
tcp        0      0 0.0.0.0:55153           0.0.0.0:*               LISTEN      1025/rpc.statd
tcp        0      0 10.1.11.27:53           0.0.0.0:*               LISTEN      1343/named
tcp        0      0 192.168.1.101:53        0.0.0.0:*               LISTEN      1343/named
tcp        0      0 127.0.0.1:53            0.0.0.0:*               LISTEN      1343/named
tcp        0      0 0.0.0.0:22              0.0.0.0:*               LISTEN      979/sshd
tcp        0      0 127.0.0.1:631           0.0.0.0:*               LISTEN      1828/cupsd
tcp        0      0 0.0.0.0:7001            0.0.0.0:*               LISTEN      10129/transmission
tcp        0      0 0.0.0.0:25              0.0.0.0:*               LISTEN      1694/master
tcp        0      0 127.0.0.1:953           0.0.0.0:*               LISTEN      1343/named
tcp        0      0 0.0.0.0:8000            0.0.0.0:*               LISTEN      1539/icecast2
tcp6       0      0 :::80                   :::*                    LISTEN      1899/apache2
tcp6       0      0 :::53                   :::*                    LISTEN      1343/named
tcp6       0      0 :::22                   :::*                    LISTEN      979/sshd
tcp6       0      0 ::1:631                 :::*                    LISTEN      1828/cupsd
tcp6       0      0 :::7001                 :::*                    LISTEN      10129/transmission
tcp6       0      0 ::1:953                 :::*                    LISTEN      1343/named
udp        0      0 239.255.255.250:1900    0.0.0.0:*                           11937/opera
udp        0      0 0.0.0.0:111             0.0.0.0:*                           936/portmap
udp        0      0 0.0.0.0:777             0.0.0.0:*                           1025/rpc.statd
udp        0      0 0.0.0.0:38297           0.0.0.0:*                           1025/rpc.statd
udp        0      0 192.168.1.101:33843     0.0.0.0:*                           11937/opera
udp        0      0 10.1.11.27:53           0.0.0.0:*                           1343/named
udp        0      0 192.168.1.101:53        0.0.0.0:*                           1343/named
udp        0      0 127.0.0.1:53            0.0.0.0:*                           1343/named
udp        0      0 0.0.0.0:68              0.0.0.0:*                           5840/dhclient
udp        0      0 127.0.0.1:11211         0.0.0.0:*                           1550/memcached
udp        0      0 0.0.0.0:7001            0.0.0.0:*                           10129/transmission
udp        0      0 10.1.11.27:33372        0.0.0.0:*                           11937/opera
udp6       0      0 :::53                   :::*                                1343/named  

Display All TCP Sockets

Type the ss command as follows:
# ss -t -a
Or use the netstat command as follows:
# netstat -nat

Display All UDP Sockets

Type the ss command as follows:
# ss -u -a
Or use the netstat command as follows:
# netstat -nau

lsof Command

You can use the lsof command follows to list more information about open ports:
# lsof -i :portNumber
# lsof -i tcp:portNumber
# lsof -i udp:portNumber
# lsof -i :80 | grep LISTEN

View Established Connections Only

Use the netstat command as follows:
# netstat -natu | grep 'ESTABLISHED'

Say Hello To tcptrack

The tcptrack command displays the status of TCP connections that it sees on a given network interface. tcptrack monitors their state and displays information such as state, source/destination addresses and bandwidth usage in a sorted, updated list very much like the top command.
# tcptrack -i eth0
Sample outputs:
Fig.01: tcptrack in Action

See how to install and use the tcptrack tool under Linux for more information.

iftop command

The iftop command listens to network traffic on a given network interface such as eth0, and displays a table of current bandwidth usage by pairs of hosts:
# iftop -i eth1
It can display or analyses packet flowing in and out of the 192.168.1.0/24 network:
# iftop -F 192.168.1.0/24
Sample outputs:
Fig.02: iftop command in action

See how to install and use iftop command under Linux for more information.

iptables rules can be easily import and export

Some of the distro will come with default iptables rules such as RH based linux, but some of the distro such as ubuntu didn’t include that.
iptables rules can be insert by command iptables itself.
iptables -A INPUT -p udp --dport 222 -j ACCEPT
The above line append (-A) a rule in table INPUT, which indicate to ACCEPT packets come from anyplace with protocol udp and destination port 222. Iptables capable to do a lots more. To master it, you may consider to search for a book.
To easily setup firewalls for those distro who do not have one, i have a trick. Search for the distro which have default iptables rules, copy out the rules and store into a file, like this.
iptables-save > iptables.conf
The rules will be copy out and looks like this
# Generated by iptables-save v1.3.3 on Sun Sep 24 11:23:35 2006
*filter
:INPUT ACCEPT [0:0]
:FORWARD ACCEPT [0:0]
:OUTPUT ACCEPT [35:1959]
:RH-Firewall-1-INPUT - [0:0]
-A INPUT -j RH-Firewall-1-INPUT
-A FORWARD -j RH-Firewall-1-INPUT
-A RH-Firewall-1-INPUT -i lo -j ACCEPT
-A RH-Firewall-1-INPUT -p icmp -m icmp --icmp-type any -j ACCEPT
-A RH-Firewall-1-INPUT -p esp -j ACCEPT
-A RH-Firewall-1-INPUT -p ah -j ACCEPT
-A RH-Firewall-1-INPUT -p udp -m udp --dport 631 -j ACCEPT
-A RH-Firewall-1-INPUT -m state --state RELATED,ESTABLISHED -j ACCEPT
-A RH-Firewall-1-INPUT -p tcp -m state --state NEW -m tcp --dport 22 -j ACCEPT
-A RH-Firewall-1-INPUT -p udp -m state --state NEW -m udp --dport 137 -j ACCEPT
-A RH-Firewall-1-INPUT -p udp -m state --state NEW -m udp --dport 138 -j ACCEPT
-A RH-Firewall-1-INPUT -p tcp -m state --state NEW -m tcp --dport 139 -j ACCEPT
-A RH-Firewall-1-INPUT -p tcp -m state --state NEW -m tcp --dport 445 -j ACCEPT
-A RH-Firewall-1-INPUT -j REJECT --reject-with icmp-host-prohibited
COMMIT
# Completed on Sun Sep 24 11:23:35 2006
Then you can copy this file and restore at the machine you would like to have the same firewall rules.
iptables-restore < iptables.conf
To list all the rules binds on the machine, simply do this
iptables -L
To flush all iptables rules, means you clear off all rules and remains nothing, do this
iptables -F
To be better control will loaded automatically when machine startup, you can actually write a script and store at /etc/init.d. Check out this :

Saturday, April 2, 2016

Chặn IP Trung Quốc bằng Iptables + Ipset

WHY ? 


Không phải phân biệt chủng tộc hay kích động thù hằn dân tộc nhưng có một sự thật là TQ là nước chiếm tỉ lệ lớn nguồn gốc các cuộc tấn công mạng vào các Website của thế giới nói chung và VN nói riêng. Nhiều website nước ngoài cũng tiến hành chặn IP Trung Quốc để ngủ ngon hơn, mình cũng nên học hỏi.
Lưu ý : Việc chặn IP chỉ là biện pháp đối phó tương đối (chỉ hiệu quả trước một số loại tấn công như DoS, Spam..) . Đối với những kẻ tấn công có chủ đích nhắm vào ứng dụng của bạn thì chúng có thừa thủ đoạn để qua mặt các bộ lọc IP. Về lâu dài, bạn cần định kỳ kiểm trả bảo mật và đảm bảo các quy tắc lập trình an toàn trong quá trình phát triển.

HOW ?


Công cụ :

  • iptables - firewall mặc định trên hầu hết Linux Distro (Lưu ý : CentOS 7 và FC20 trở đi sử dụng firewallD thay thế iptables, cần cài lại iptables thay thế firewallD hoặc viết rule cho firewallD)
  • ipset - công cụ hỗ trợ iptables, có chức năng tạo cái list IP để add rule cho iptables (Cài đặt : yum install ipset hoặc apt-get install ipset)
Tạo file bash script có nội dung :
/etc/china-block.sh
# Tạo list ipset tên china
ipset -N china hash:net # Xóa nội dung file cn.zone cũ (file danh sách IP china) để cập nhật list mới.
rm ~/cn.zone
# Tải list IP Trung Quốc mới nhất về từ site ipdeny, lưu ở home
wget -P ~ http://www.ipdeny.com/ipblocks/data/countries/cn.zone
# Đọc từng dòng trong file cn.zone rồi lưu vào list ipset china
for i in $(cat ~/cn.zone ); do ipset -A china $i; done
# Restore các rule iptables khi khởi động lại
/sbin/iptables-restore < /etc/iptables.firewall.rules
Thêm rule vào file iptables.firewall.rules
-A INPUT -p tcp -m set --match-set china src -j DROP
Chạy thử file china-block.sh
$ sh china-block.sh
Kiểm tra kết quả
$ iptables -L Chain INPUT (policy ACCEPT)
target     prot opt source               destination
...
DROP       tcp  --  anywhere             anywhere             match-set china src
..
Cuối cùng là tạo crontab định kỳ thực hiện sáng sớm mỗi ngày
$ crontab -e * 1 * * * /etc/china-block.sh

Chống DDOS với iptables

Giới thiệu về iptables

Nguyên tắc làm việc của iptables là nó cho phép người dùng định nghĩa các quy tắc (rules), các quy tắc này nằm trong bộ nhớ và sẽ được iptables kiểm tra để thực thi mỗi khi có một request đến máy chủ. Nếu một request thỏa mãn quy tắc, nó sẽ được thực hiện theo action của quy tắc đó.

Các request được nhận diện bằng các thông số sau:
- địa chỉ nguồn (một ip hay cả một dải ip)
- địa chỉ đích
- giao thức (giao thức phổ biến là TCP/IP)
- cổng (các cổng phổ biến là cổng 80 http, cổng 21 ftp ...)
- interface vật lý (là request đến từ card mạng nào của máy chủ)

Còn các action mà iptables có thể thực hiện là
- ACCEPT cho phép request đó được thực hiện, hay nói đúng hơn là cho gói tin thỏa mãn các điều kiện trên đi qua.
- REJECT không cho phép gói tin đi qua, gửi trả lại địa chỉ xuất phát request một thông báo
- DROP không cho phép gói tin đi qua và cũng không gửi trả lại thông báo gì
- LOG cho phép gói tin đi qua nhưng sẽ ghi log lại để phân tích
- DNAT cho phép gói tin đi qua nhưng dùng NAT để thay thế địa chỉ đích
- SNAT cho phép gói tin đi qua nhưng dùng NAT để thay thế địa chỉ nguồn

Ngoài ra các rules còn được kiểm soát bởi kiểu của request, có 3 kiểu sau đây
- INPUT: là các request đến máy chủ
- FORWARD: là các request đi qua máy chủ (vào cổng mạng này và đi ra cổng mạng khác) nó áp dụng trong trường hợp máy chủ của bạn làm việc như một routing server.
- OUTPUT: áp dụng cho các request đi từ máy chủ ra ngoài (ví dụ bạn không muốn các website trên VPS của bạn truy cập đến một website khác nằm ở đâu đó trên internet).

Các lệnh quản lý iptables


Bạn có thể khởi tạo một rule và kiểm tra iptables ngay từ dùng lệnh của hệ điều hành linux. Dưới đây là một số lệnh cơ bản

Kiểm tra xem dịch vụ iptables đã chạy hay chưa:
     # service iptables status

Nếu như iptables đang chạy nó sẽ liệt kê ra các rules nằm trong 3 kiểu là chain INPUT, chain FORWARD và chain OUTPUT. Nếu như iptables chưa chạy sẽ có thông báo là Firewall is stopped. Lưu ý là trong trường hợp chưa có một rule nào đã được định nghĩa, thì có thể bạn cũng nhận được thông báo Firewall is stopped. Lúc đó bạn chỉ cần thêm vào một rules là iptables sẽ được bật.

Bật dịch vụ iptables
     # service iptables start

Khởi động lại dịch vụ iptables. Thông thường mỗi khi bạn tạo rules từ dòng lệnh, thì các rule này có hiệu lực ngay. Tuy nhiên trong trường hợp bạn tạo rules vào file thì bạn cần dùng lệnh sau để khởi động lại iptables và tải lại các rules từ file

     # service iptables restart

Ghi các rules hiện thời vào file. Thông thường các rules được lưu trong bộ nhớ RAM để thực thi cho nhanh. Tuy nhiên khi tắt máy hoặc khởi động lại, các rules này sẽ không còn. Để lưu lại các rules bạn cần thực hiện lệnh sau:

# service iptables save

Lệnh trên sẽ lưu các rules đang chạy vào file /etc/sysconfig/iptables Sau khi đã có file này, các bạn có thể thêm trực tiếp các rules vào trong file này. Tuy nhiên lưu ý là các rules trong iptables sẽ có tác dụng ngay lập tức vì vậy để tránh tạo ra các rules lỗi, bạn nên tạo các rules trong một file nháp ví dụ như file /etc/sysconfig/iptables.tmp  sau đó chạy kiểm tra iptables bằng lệnh sau:

# iptables-restore < /etc/sysconfig/iptables.tmp

Nếu các bạn muốn lưu các rules đang chạy ra một file bất kỳ (để backup hoặc để gửi cho người khác) thì có thể dùng lệnh sau

# iptables-save > /etc/sysconfig/iptables.backup

Nếu dùng lệnh trên mà không có tên file theo sau, nó sẽ in các rules đang chạy ra màn hình để bạn kiểm tra.

Các lệnh tạo rules cho iptables.


Cú pháp chung cho các lệnh tạo rules của iptables như sau

# iptables [command] [kiểu] [mô tả rule] [-j acction]

Trong đó kiểu là INPUT, FORWARD, hoặc OUTPUT như đã nói ở trên. Acction = ACCEPT, REJECT, DROP.... như đã nói ở trên, còn command, các bạn có thể tham khảo danh sách các command bằng cách gõ lệnh:

# iptables -h

Các command thông dụng là:
      - I  (Thêm một quy tắc mới vào iptable)
      - A (chèn thêm các mô tả vào một quy tắc)
      - D (xóa bỏ một quy tắc)

Còn đoạn mô tả rule thì được xây dựng từ địa chỉ nguồn, địa chỉ đích, cổng dịch vụ, cổng mạng.... các bạn tìm hiểu các rule này qua các ví dụ sau:

- Rule 1: chặn một địa chỉ bên ngoài đến interface ethe0 và truy xuất cổng 80 giao thức tcp,  tới địa chỉ đích 27.118.22.10
      -s 116.10.191.15 -i ethe0 -d 27.118.22.10 -p tcp --dport 80

- Rule 2:  chặn một network (cả một dải ip) truy xuất các cổng 3000 đến 4000 của địa chỉ 27.118.22.10
      -s 116.10.191.0/24 -d 27.118.22.10 -p tcp --dport 3000:4000

- Rule 3: Cấm một ip dùng cổng 20 (ftp) truy xuất đến máy chủ
      -s 116.10.191.15 -d 27.118.22.10 -p tcp --sport 20

Giải thích các option:

      -s (chỉ ra địa chỉ nguồn của gói tin)
      -d (chỉ ra địa chỉ đích của gói tin)
      -p (chỉ ra giao thức, có thể là tcp, icmp, udp....)
      -dport (chỉ ra các cổng dịch vụ ở địa chỉ ip đích )
      -sport (chỉ ra các cổng dịch vụ của ip nguồn)
      -i (chỉ ra cổng vật lý mà gói tin xuất hiện ví dụ cổng ethe0)

Tham khảo các option khác bằng lệnh # iptables -h

Bây giở chúng ta sẽ ghép các thành phần trên để tạo thành một rule thực sự. Giả sử chúng ta cần cấm tất cả các gói tin có địa chỉ IP nguồn đến từ một network là 116.10.191.0 đi đến VPS của chúng ta, bất kể là gói tin đó sử dụng giao thức gì, dịch vụ gì, và bất kể nó đòi truy xuất đến địa chỉ IP nào, chúng ta gõ lệnh sau trực tiếp vào dòng lệnh của hệ điều hành

# iptables -I INPUT -s 116.10.191.0/24 -j DROP

Ngay sau khi gõ lệnh trên, toàn bộ các host có địa chỉ IP là 116.10.191.x sẽ không còn truy xuất được đến máy VPS của bạn nữa.  Nếu muốn xóa bỏ quy tắc trên, chúng ta gõ lệnh

# iptables -D INPUT -s 116.10.191.0/24 -j DROP

Sau khi thực hiện việc tạo, thêm bớt các rule, các bạn nhớ dùng lệnh sau để ghi lại các rules để nếu như có khởi động lại VPS thì iptables có thể dùng lại các rule này.

# service iptables save

Sau đó cũng cần phải đặt chế độ tự khởi động dịch vụ iptables mỗi lần khởi động VPS bằng lệnh sau:

# chkconfig iptable on

Áp dụng iptables


Qua các bước trên các bạn đã biết cách dùng iptables để ngăn chặn các truy xuất từ các IP xấu. Vậy bây giờ chúng ta sẽ dùng nó như thế nào? Để chống lại các cuộc tấn công DDOS, chúng ta có nhiều phương án khác nhau.

Cách thứ nhất: Phân tích log

Phân tích thường xuyên file log để biết IP nào hay trọc phá VPS và block ip đó. Các bạn hãy xem toàn bộ file /var/log/secure để biết được các request bất thường hay đến từ địa chỉ IP nào. Sau đó  các bạn tạo ra một file shell như sau để dùng nhiều lần

# cd /etc/sysconfig/
# vi iptables.sh (sau đó đặt các lệnh tạo rules của iptables vào trong file này)
# chmod +x iptables.sh   (cho phép chạy file này)
# ./iptables.sh  (chạy file để tạo ra các rules)

Từ nay về sau mỗi khi phát hiện một ip xấu nào, bạn chỉ cần thêm một dòng vào file iptables.sh này và chạy nó thì các rules sẽ được tạo ra.

Cách thứ 2: Chặn IP theo vùng

Nhận xét thấy là các cuộc tấn công DDOS thường đến từ các quốc gia như Trung Quôc, Hàn Quốc... trong khi VPS của bạn không có khách hàng nào ở các quốc gia này thì bạn có thể chặn toàn bộ IP của các nước có nghi ngờ xuất phát các cuộc tấn công DDOS như sau:

Đầu tiên bạn cần có danh sách ip của các quốc gia này. Ví dụ danh sách các IP hay tấn công DDOS từ Trung Quốc các bạn có thể lấy ở link này: http://www.ipdeny.com/ipblocks/data/countries/cn.zone

Khi đã có link, các bạn lấy danh sách ip đó về một file gọi là iptables.block.list bằng lệnh sau

# wget -c --output-document=iptables.block.list http://www.ipdeny.com/ipblocks/data/countries/cn.zone

Sau khi có file danh sách này bạn viết một script như sau:

#vi iptables.sh
Nội dung file:
#!/bin/bash
WORKDIR="/root"
#######################################
cd $WORKDIR
if [ -f iptables.block.list ]; then
  iptables -F
  BLOCKDB="iptables.block.list"
  IPS=$(grep -Ev "^#" $BLOCKDB)
  for i in $IPS
  do
    iptables -A INPUT -s $i -j DROP
  done
fi

Tiếp theo là chạy file iptables.block.list và nhớ save danh sách bằng lệnh service iptables save như các bước trên.


File iptables-config


File /etc/sysconfig/iptables-config có chứa một số cấu hình cho dịch vụ iptables. Các bạn cũng nên tìm hiểu một số lệnh trong file này để ứng dụng.

IPTABLES_SAVE_ON_STOP = "no"  Giá trị này nên chuyển thành "yes" khi đó mỗi lần stop iptables (hay là khi tắt máy) thì các rules trong bộ nhớ sẽ được save vào file /etc/sysconfig/iptables để tải lại các lần sau

IPTABLES_SAVE_ON_RESTART ="no"  Giá trị này nếu sửa thành "yes" thì mỗi khi restart dịch vụ iptables, các rules cũng được ghi lại vào file

... ngoài ra còn một số tham số khác các bạn tự tìm hiểu thêm

Nguyên tắc cuối cùng: chống tự tử

Những ai đã từng làm filtering và firewalling đều có những bài học xương máu về việc tự sát. Đó là trong khi mải mê tạo ra các rules để ngăn chặn các cuộc tấn công, vô tình chúng ta cấm luôn cả ip của chính mình và kể từ đó không còn access được vào server nữa. Để tránh gặp phải thảm cảnh này, các bạn nên tuân thủ một số nguyên tắc sau:

1- The First match rule.

Trước khi tạo bất cứ một rules nào bạn cần phải tạo một rule cho phép chính mình và đặt ở đầu file iptables. Bởi vì mọi firewall đều làm việc theo nguyên tắc duyệt các rule từ trên xuống dưới, nếu thỏa mãn thì áp dụng ngay bất kể các rule bên dưới có match hay không. Vậy nên các trong khi thao tác với iptables, bạn cần biết IP của máy mình đang dùng là gì. Nếu có ip tĩnh thì quá tốt, nếu không thì cũng phải biết dải ip mà ADSL của mình thường xuyên được cấp. Sau đó tạo một rules đầu tiên trong file iptables như sau:

-A INPUT -s 111.111.111.111/32 -j ACCEPT

Trong đó 111.111.111.111 giả định là ip mà máy của bạn đang dùng. Nếu như bạn có một dài IP hay dùng thì thay bằng dòng

-A INPUT -s 111.111.111.0/24 -j ACCEPT

Như vậy bất kể sau đó bạn có khai báo một lệnh DROP hay REJECT nào thì ip của bạn vẫn access được đến server mà không sợ thiết lập rules "tự tử" cấm chính mình.

2- Alway got the second road.

Cho dù bạn cẩn thận đến đâu, kể cả khi bạn đã áp dụng nguyên tắc thứ nhất thì vẫn có thể bạn không access được vào server, chẳng hạn như bạn đã mở ip của bạn, nhưng mạng của nhà cung cấp dịch vụ lại cấm ip của bạn thì sao? hoặc giả bạn cho phép dải ip ở công ty của bạn access, nhưng bạn đang ở quán cafe wifi và muốn access vào VPS thì sao? Để tránh tình huống này bạn cần tạo ra một rule thứ 2 cho phép một máy dự phòng và máy này thì bạn có thể remote từ xa vào để thao tác. Hãy add thêm dòng lệnh sau vào ngay bên dưới dòng lệnh nêu trên trong file iptables

-A INPUT -s 222.222.222.222/32 -j ACCEPT

trong đó 222.222.222.222 là máy dự phòng để bạn có thể access vào máy chủ khi mà IP thứ nhất bị cấm.

3- Kiểm tra tất cả mọi thứ trước khi đặt lệnh chkconfig on

Các tác giả iptables đã lường trước rằng người dùng sẽ có thể vô tình tự tử khi thiết lập rule nên họ đặt ra một nguyên tắc là iptables làm việc với các rule thường trực trong RAM và chỉ save xuống iptables để lưu. Đồng thời họ để chế độ ngầm định là iptables sẽ không khởi động mỗi khi reboot máy. Đây là một cơ may cuối cùng khi bạn bị cấm ip. Lúc đó chỉ cần khởi động lại máy là các rules trong RAM sẽ bị xóa sạch và thậm chí là iptables sẽ không khởi động theo máy nên bạn sẽ có thể access lại máy chủ sau khi reboot. Tôn trọng nguyên tắc này bạn cần lưu ý mấy điểm sau:

  • Gõ các rules từ dòng lệnh của linux để rules ghi vào ram chứ không ghi vào file iptables, để kiểm tra xem rule có tác động như thế nào, nếu sau khi ứng dụng rule mà bị ngắt thì khởi động lại server.
  • Save các rule từ RAM sang một file tạm trước khi save vào iptable bằng lệnh iptables-save > filename. Việc này vừa để backup iptables và vừa đảm bảo là các rules được test kỹ trước khi save lại vào file cấu hình.
  • Hãy kiểm tra cẩn thận trước khi gõ lệnh chkconfig iptables on vì sau khi gõ lệnh này, mỗi lần khởi động lại server sẽ tự load file iptables lên và áp dụng các rules ngay, do vậy nếu như đã trót save các lệnh "tự tử" vào file iptables mà lại đặt lệnh chkconfig on cho dịch vụ này thì coi như hết thuốc chữa.

Twitter Delicious Facebook Digg Stumbleupon Favorites More

 
Design by Free WordPress Themes | Bloggerized by Lasantha - Premium Blogger Themes | Powerade Coupons